Key Takeaways: Biologics Growth and Commercial Market Trends
Biologics dominate commercial pharma revenues because large molecules accounted for 32 of the top 50 best-selling drugs in 2024, generating $252 billion in gross sales compared to $130 billion for small molecules.
Oncology R&D is the primary growth engine for biologics because anticancer treatments represent 37% of pipeline expenditure and 29% of FDA approvals, with programmed cell death protein 1 (PD-1) inhibitors like Keytruda and Opdivo expanding the immuno-oncology sector at a 20.2% CAGR.
Therapeutic pipeline chemistry is shifting toward biopharmaceuticals because biologics now represent 45% of active therapies in development, led by recombinant proteins (4,553 candidates) and advanced therapies (3,356 candidates).
Antibody-Drug Conjugates (ADCs) are the fastest-growing therapeutic modality because active ADC pipeline products surged to 551 candidates in 2024 (up from 405 in 2023), claiming 20% of the entire antibody pipeline.
1 Market Overview
1.1. Biologic drugs have been steadily gaining market share since the first biologic was approved by the U.S. Food and Drug Administration (FDA) in 1982. Historically, small molecule active pharmaceutical ingredients (APIs) held paramount significance within the global pharmaceutical industry, but they now represent only 69% of all new drugs approved by the FDA in the past decade (see Figure 1).[1] The trend continues through 2024. Two-thirds of 2024 new drug applications (NDAs) were for small molecules (Figure 2).[1]
Figure 1. Chemistry of New Drug Approvals, 2013–2024
The general molecule class of new drugs approved (NDAs) by the FDA from Jan 1, 2013 to Dec 31, 2024. Peptides are counted as large molecules in this analysis. Data analysis by Nice Insight, March 2025.
Figure 2. Chemistry of New Drug Approvals, 2024
The general molecule class of new drugs approved (NDAs) by the FDA from Jan 1, 2013 to Dec 31, 2024. Peptides are counted as large molecules in this analysis. Data analysis by Nice Insight, March 2025.
1.2. Of the 50 top-selling drugs in 2024, small molecules accounted for about one-third of the molecules on the list (Figure 3) and one-third of the total sales (Figure 4).
Figure 3. Chemistry of 50 Top-Selling Drugs by Molecule Type, 2024
The 50 drugs with the highest grossing worldwide sales in 2024, were categorized according to the molecule type. Peptides are counted as large molecules in this analysis. Source: Global Data. Data analysis by Nice Insight, Sept 2025.
Figure 4. Sales of Top 50 Drugs of 2024 by Molecule Class
The 50 drugs with the highest grossing worldwide sales in 2024, were categorized according to the molecule type. Total sales in $billions U.S. by molecule type are reported. Peptides are counted as large molecules in this analysis. Data analysis by Nice Insight, Sept 2025.
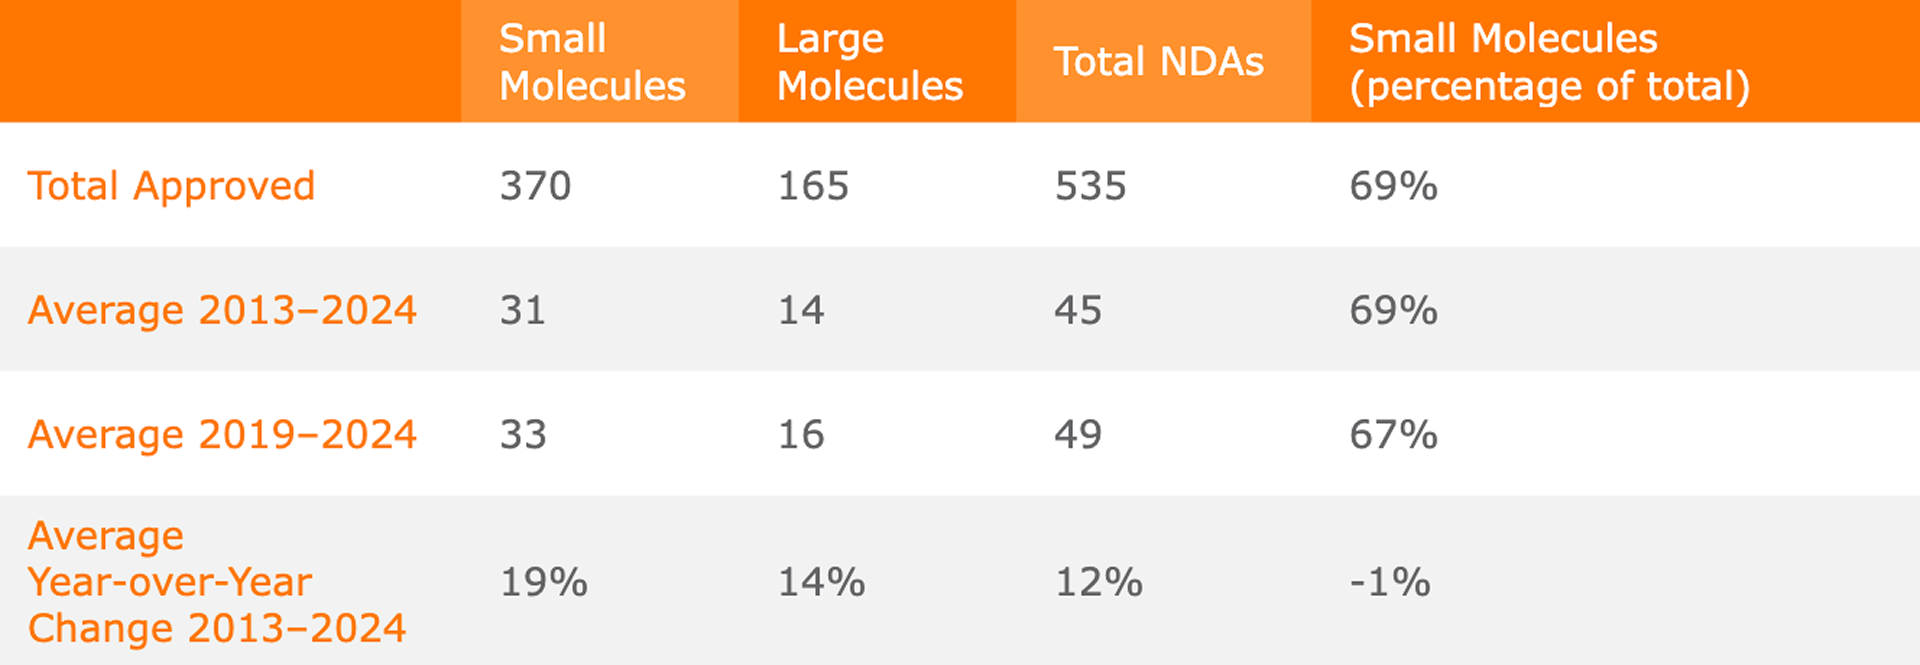
1.3. While the rate of approval of both classes has grown during the past decade, the ratio of small molecules to large molecules has decreased slightly (see Figure 5 and Table 1).[2]
Figure 5. Chemistry of New Drug Approvals Annually, 2013–2025
The general molecule class of new drugs approved each year by the FDA from Jan 1, 2013 to Dec 31, 2025. Peptides are counted as large molecules in this analysis. Data analysis by Nice Insight, March 2026.
Table 1. Chemistry of NDA Approvals Since 2013
Analysis by Nice Insight, March 2025.
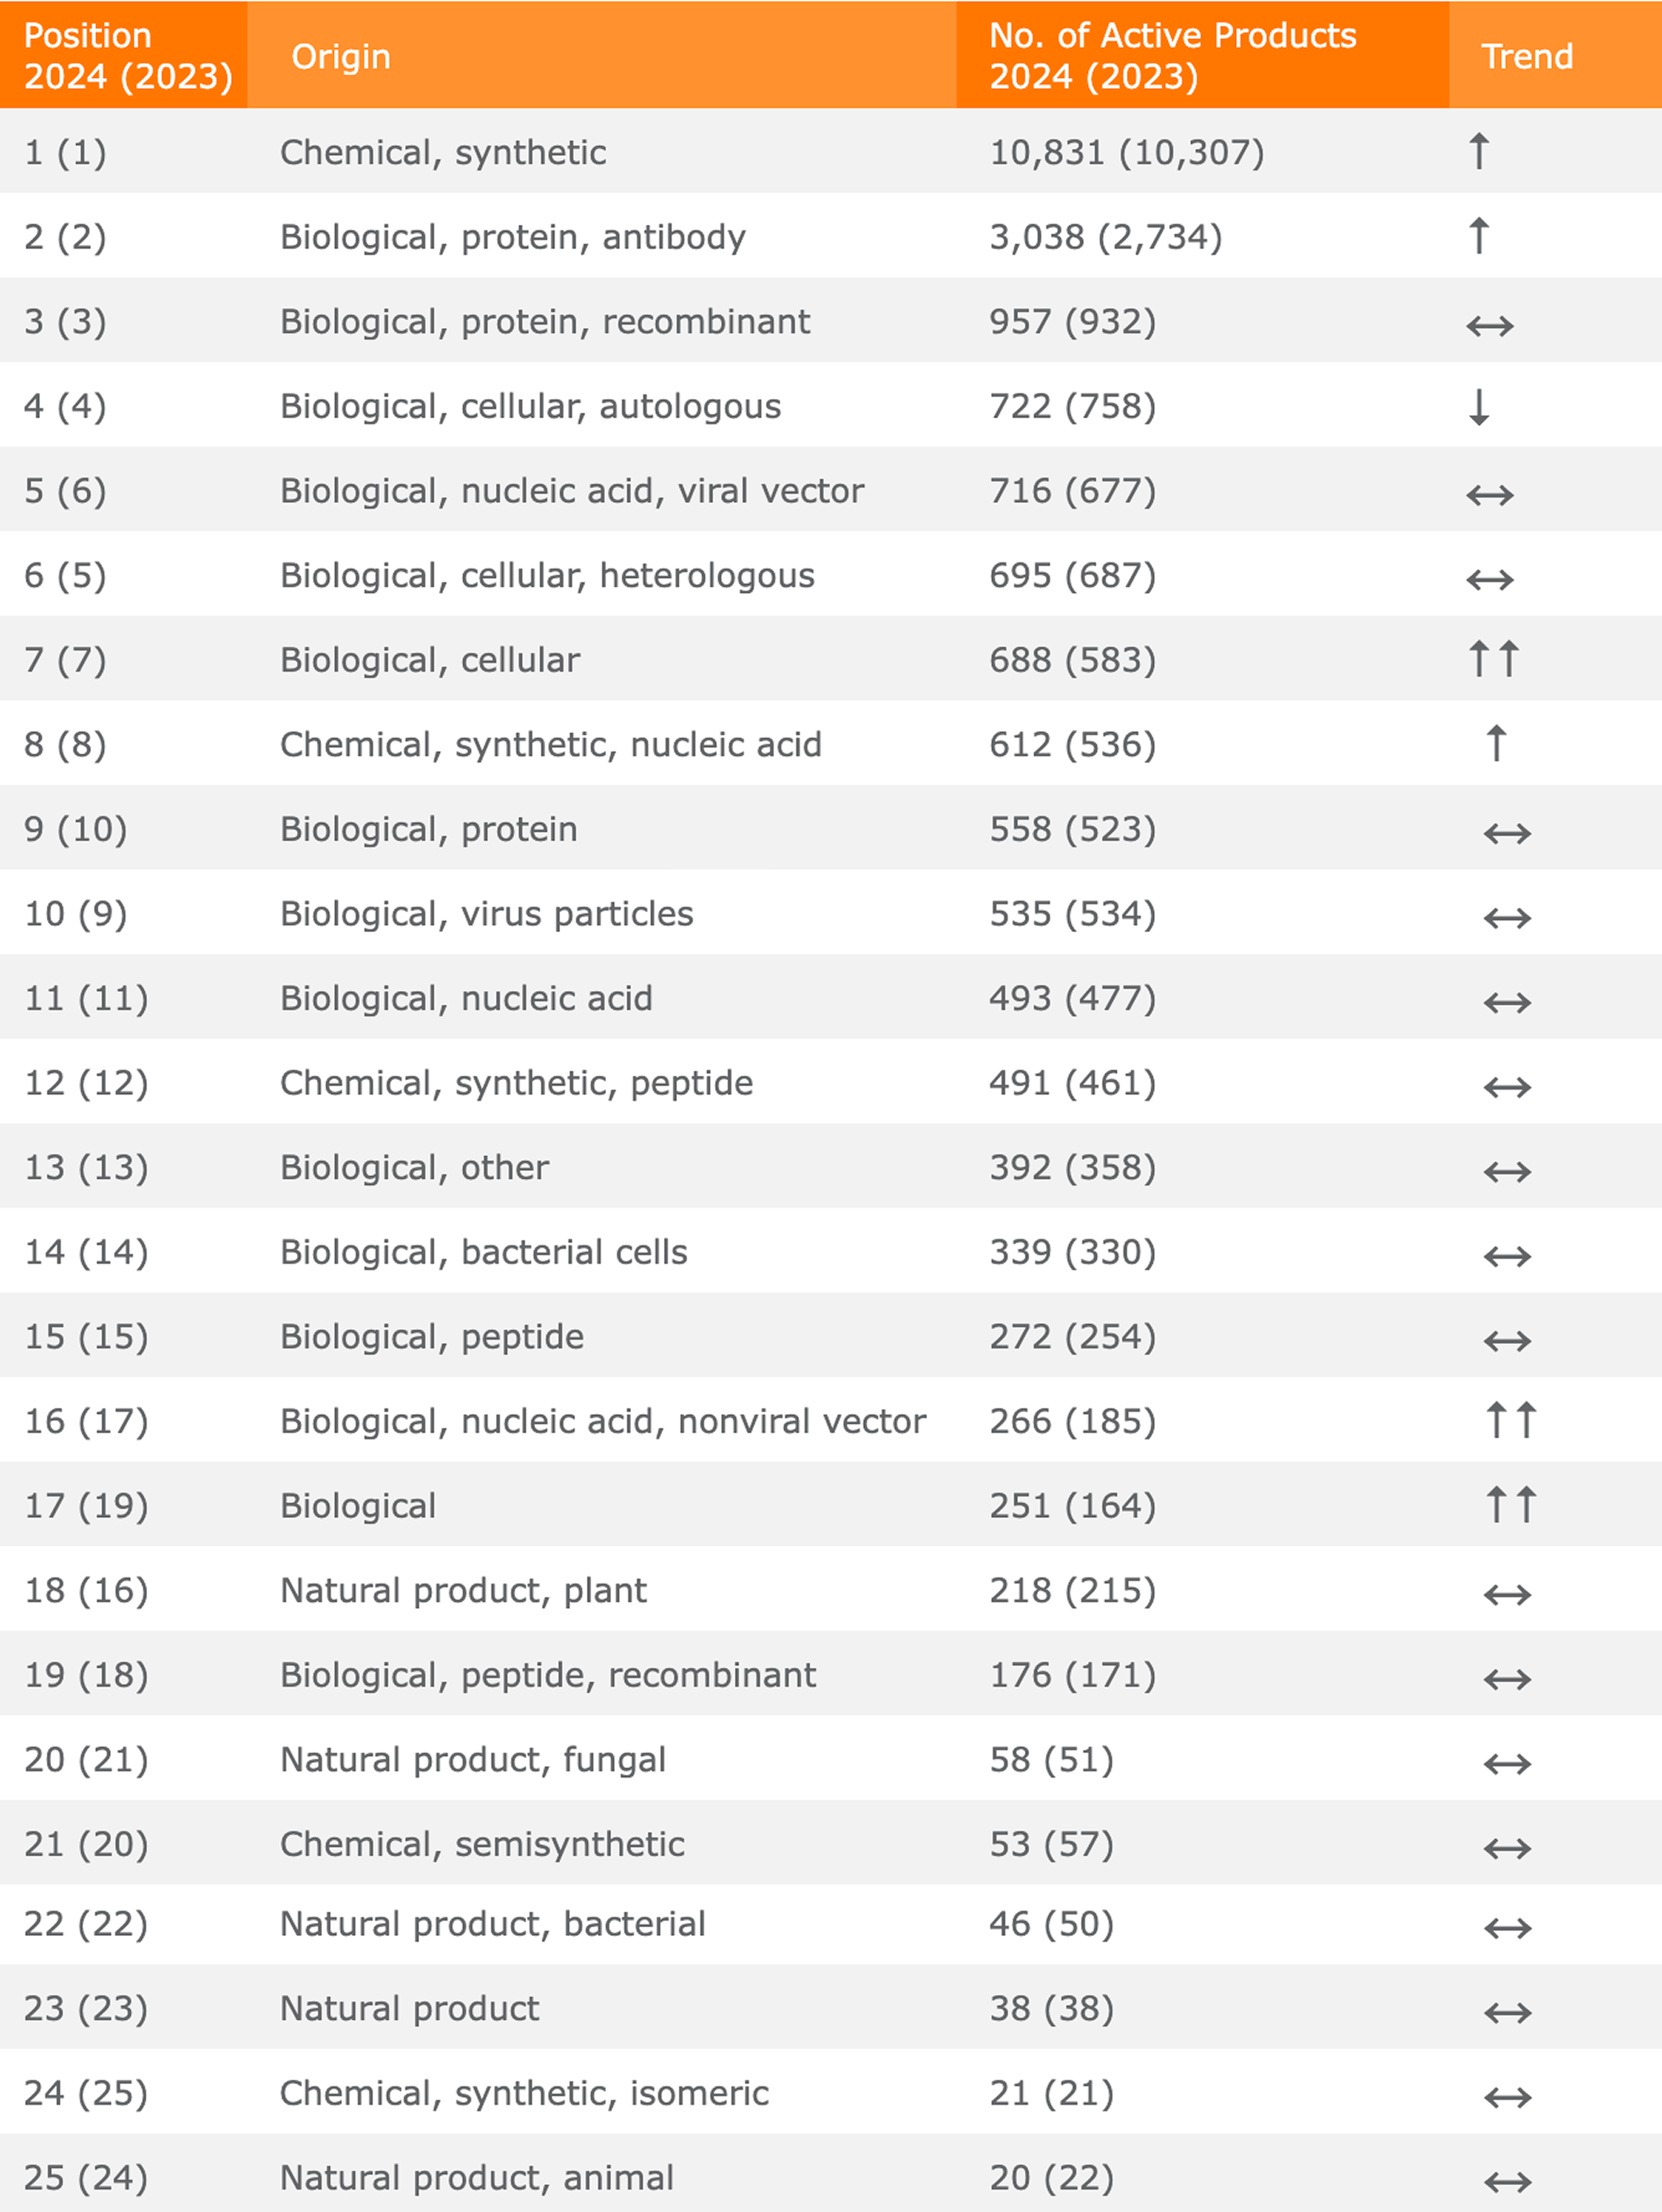
1.4. The pattern of biologics increasing market share in the market is set to continue. Although the majority of the therapeutic pipeline remains small molecules, biologics represent a full 45% of therapies in development (see Figure 5; detail provided in Table 2).[2] Given the higher success rate in the clinic of biologics and the rise of biosimilars, we anticipate biologics will continue to increase in terms of number of drugs, percentage of approved therapies, and portion of sales in the global biopharmaceutical market.
Figure 6. Origin of Pipeline Drugs
The chemistry of pipeline therapeutics as reported by Citeline is summarized.[2]
Table 2. Detail of Chemistry of Pipeline Drugs, 2024
Source: Citeline[2]; Nice Insight 2024
1.5. It is instructive to view the ratio of small molecule and biologics-based therapies by the indication for which they are developed. As demonstrated in Figure 7, the ratio varies significantly across different indications. Compare, for example, two of the largest areas of research: cardiovascular disease and oncology. Cardiovascular diseases are overwhelmingly treated with small molecules while oncologic indications are treated mostly with biologics. Figure 8 provides a snapshot of the number of therapies in development.
Figure 7. Classes of Biological Drugs in the Pipeline
The "biological" drugs from the previous figure are sorted into more precise therapeutic modalities. Source: Citeline.
Figure 8. Late-Stage Pipeline: Portion of Each Molecule Class by Indication
The portion of therapeutics in phase II and phase III trials is sorted by class and indication. For this analysis, “Biotech” includes therapies that are biologics, cell therapies, and polymers. Source: GlobalData
Figure 9. Late-Stage Pipeline: Number of Each Molecule Class by Indication
The number of therapeutics in phase II and Phase III trials is sorted by class and indication. For this analysis, "Biotech" includes therapies that are biologics, cell/gene therapies, and polymers. All oligonucleotide values (shown in blue) are 22 or less. Source: Global Data
2 Therapeutics Market Drivers
2.1. Growth in demand for biologic drugs is fueled by several factors. Increasing wealth in emerging economies is resulting in greater levels of diseases previously only observed in mature markets — such as heart disease and diabetes — as well as a growing ability to afford more advanced treatments. The global population is also aging, leading to greater incidence of chronic diseases best treated with biologic drugs. Biologics also often offer greater target specificity, efficacy, and safety profiles.
2.2. Biopharmaceutical companies have responded with the development of growing numbers of therapeutic drug candidates, particularly monoclonal antibodies (mAbs). The growing acceptance of biosimilars as less expensive but as equally effective and safe options is boosting the overall value of the market, even though it may be negatively impacting sales of originator drugs. Furthermore, in addition to developing novel biologics, branded drug manufacturers are also garnering approvals for additional indications for their existing products and engaging in various life cycle management approaches, in part to ward off biosimilar competition and extend IP coverage.
2.3. The industry’s recent focus on rare diseases is contributing to the growth of next-generation biologics — including multispecific antibodies; cell therapies; and gene, gene-modified cell, and gene-editing therapies — which is another important factor driving market growth.
2.4. Within the industry, efforts have focused largely on increasing efficiency and productivity to drive down development times and costs and thus boost revenues. These goals are being achieved with the growing use of single-use, disposable manufacturing equipment in the research labs, clinical manufacturing plants, and for commercial production as well. Advances in computer modeling capabilities, more accurate scale-down models, and high-throughput technologies are accelerating process development. Process intensification and chaining, the implementation of continuous manufacturing solutions, increased automation across the enterprise, and wider use of process analytical technologies (PATs) for real-time monitoring are also impacting quality and time to market.
2.5. Many of these trends — such as an increase in the number of manufacturing facilities to enable local, regional, redundant supply, and modular “facility-in-a-box” approaches — were accelerated by the COVID-19 pandemic.[3] A survey[4] by the Deloitte Center for Health Solutions conducted in late spring 2020 found that the pandemic not only accelerated the development, manufacturing, and marketing of drugs to treat and prevent the disease but also created greater need for stronger R&D programs and more rapid digital transformation. Biopharma companies are also challenged to address changing consumer behaviors, cyber threats, rapid advances in technology, and the rising prominence of personalized medicines.
3 Market By Therapeutic Area
3.1. Biologics, which include recombinant proteins, antibodies, growth hormones, vaccines, and cell and gene therapies, among others, have traditionally been developed to treat many complex and chronic diseases, such as rheumatoid arthritis, psoriasis, and Crohn’s disease, for which limited effective treatment options have previously been available.
3.2. In the overall pharmaceutical market, the top therapy areas, according to EvaluatePharma, are oncology, antidiabetics, immunosuppressants, vaccines, antirheumatics, and antivirals.[5] Many biologic drugs fall into these categories. Currently, biologic therapies are in development in most therapy areas, including those traditionally based on small molecules.[5]
3.3. The top-selling biologics today are anticancer medicines. This shift reflects the overall trend in the pharmaceutical industry to focus efforts in the oncology space. According to EvaluatePharma, 37% of total pipeline expenditure and 29% of total pipeline FDA approvals are for cancer treatments.[5] Strong growth is expected for oncology revenues, in part due to the growth of the immuno-oncology class, which is set to expand at a CAGR of 20.2% between 2019 and 2026, driven largely by the growth of the programmed cell death protein 1 (PD-1) inhibitors Keytruda and Opdivo, which are both mAbs. In 2026, Keytruda is predicted by EvaluatePharma to be the top-selling drug worldwide.
3.4. The autoimmune sector remains an important therapeutic class in the biopharma market, but it is expected to experience a slight decline in value from 2019 to 2026 due to the entry of biosimilars for Remicade and Humira into the market.[5]
3.5. Many biologic drugs in development target rare diseases, which reflects a second major trend in the industry: the targeting of more specialized diseases with smaller patient populations and the development of candidates with the opportunity to receive orphan drug designation, also facilitated by therapeutic advances, 1manufacturing efficiencies, and decreasing cost of goods sold (COGS).[5]
3.6. Citeline’s annual report on the therapeutic pipeline confirms these trends are continuing for 2024.[2] Their full R&D pipeline by therapeutic class is presented in Table 3. We broke out the top therapeutic modalities from the list and have presented these in Figure 10. A summary of the therapeutic indications is presented in Figure 11. The biggest rising star of the group is by far the antibody–drug conjugates. This category increased in rank further than any other and now makes up an astounding 20% of the antibody pipeline. This topic is explored in more detail in our Antibody–Drug Conjugate, ADC: Market Insight, CDMO Pricing and Competitor Benchmarking report.
Figure 10. Production Host of Orphan Drug Biologics
The production host of all orphan drugs classified as an antibody, protein, peptide or cytokine is shown. The brown value is Insect (Baculovirus, 2). Production hosts classified as "other" include human plasma, human milk, transgenic goat, transgenic cow, plants, and snake venom. Data analysis by Nice Insight, Sept 2025.
Table 3. Therapeutic Pipeline: Top Categories
Source: Citeline[2]
Figure 11. Annual FDA Approvals of Biosimilar Products
Biosimilar approvals are sorted by year. Data collected December 15, 2025.
FAQs Regarding Biologics and Biopharmaceutical Market Drivers
What is the market share of biologics compared to small molecules?
Small molecules still represent 69% of FDA new drug approvals over the past decade, maintaining a higher approval count. However, biologics command commercial dominance. Large molecules represent 64% of top-selling drug revenue, capturing $252 billion of the top 50 drugs' sales compared to $130 billion for synthetic active pharmaceutical ingredients.
Why are biopharmaceutical companies shifting focus toward biologic drug modalities?
Biopharmaceutical companies prioritize biologics because they offer superior target specificity, enhanced efficacy profiles, and lower clinical attrition rates than traditional synthetic compounds. Additionally, expanding global aging populations, rising chronic disease incidence, and strategic opportunities in orphan drug designations drive sustained R&D investment toward monoclonal antibodies and advanced therapies.
How do biosimilars impact the commercial value of originator biologic drugs?
Biosimilars reduce revenue for originator biologics by introducing lower-cost therapeutic alternatives upon patent expiration. For instance, biosimilar competition against blockbusters like Humira and Remicade is projected to cause a temporary market value contraction in the autoimmune therapeutic sector, despite expanding overall patient access and driving increased total market volume.
Which therapeutic areas dominate the late-stage biologic pipeline?
Oncology dominates the biologic pipeline, accounting for 37% of biopharma R&D expenditure and 29% of total FDA approvals. Biotech therapies make up 57% of late-stage cancer drugs, heavily driven by immuno-oncology agents like PD-1 inhibitors. Other major therapeutic areas leveraging large molecules include infectious diseases, immunology, and neurological disorders.
What role do antibody-drug conjugates play in next-generation drug development?
Antibody-drug conjugates (ADCs) serve as a high-growth targeted therapy modality, combining the precise targeting of monoclonal antibodies with potent cytotoxic payloads. Representing 20% of the active antibody pipeline, ADCs surged to 551 pipeline candidates, making them the fastest-rising biotherapeutic class for treating specialized solid tumors and hematologic malignancies.
How are bioprocessing technologies reducing cost of goods sold for biomanufacturing?
Contract development and manufacturing organizations (CDMOs) lower cost of goods sold (COGS) by adopting single-use disposable systems, continuous manufacturing, and process analytical technology (PAT). These bioprocessing innovations accelerate process development, improve batch yield consistency, enable flexible modular facility-in-a-box architectures, and optimize downstream purification for complex recombinant proteins and cell therapies.

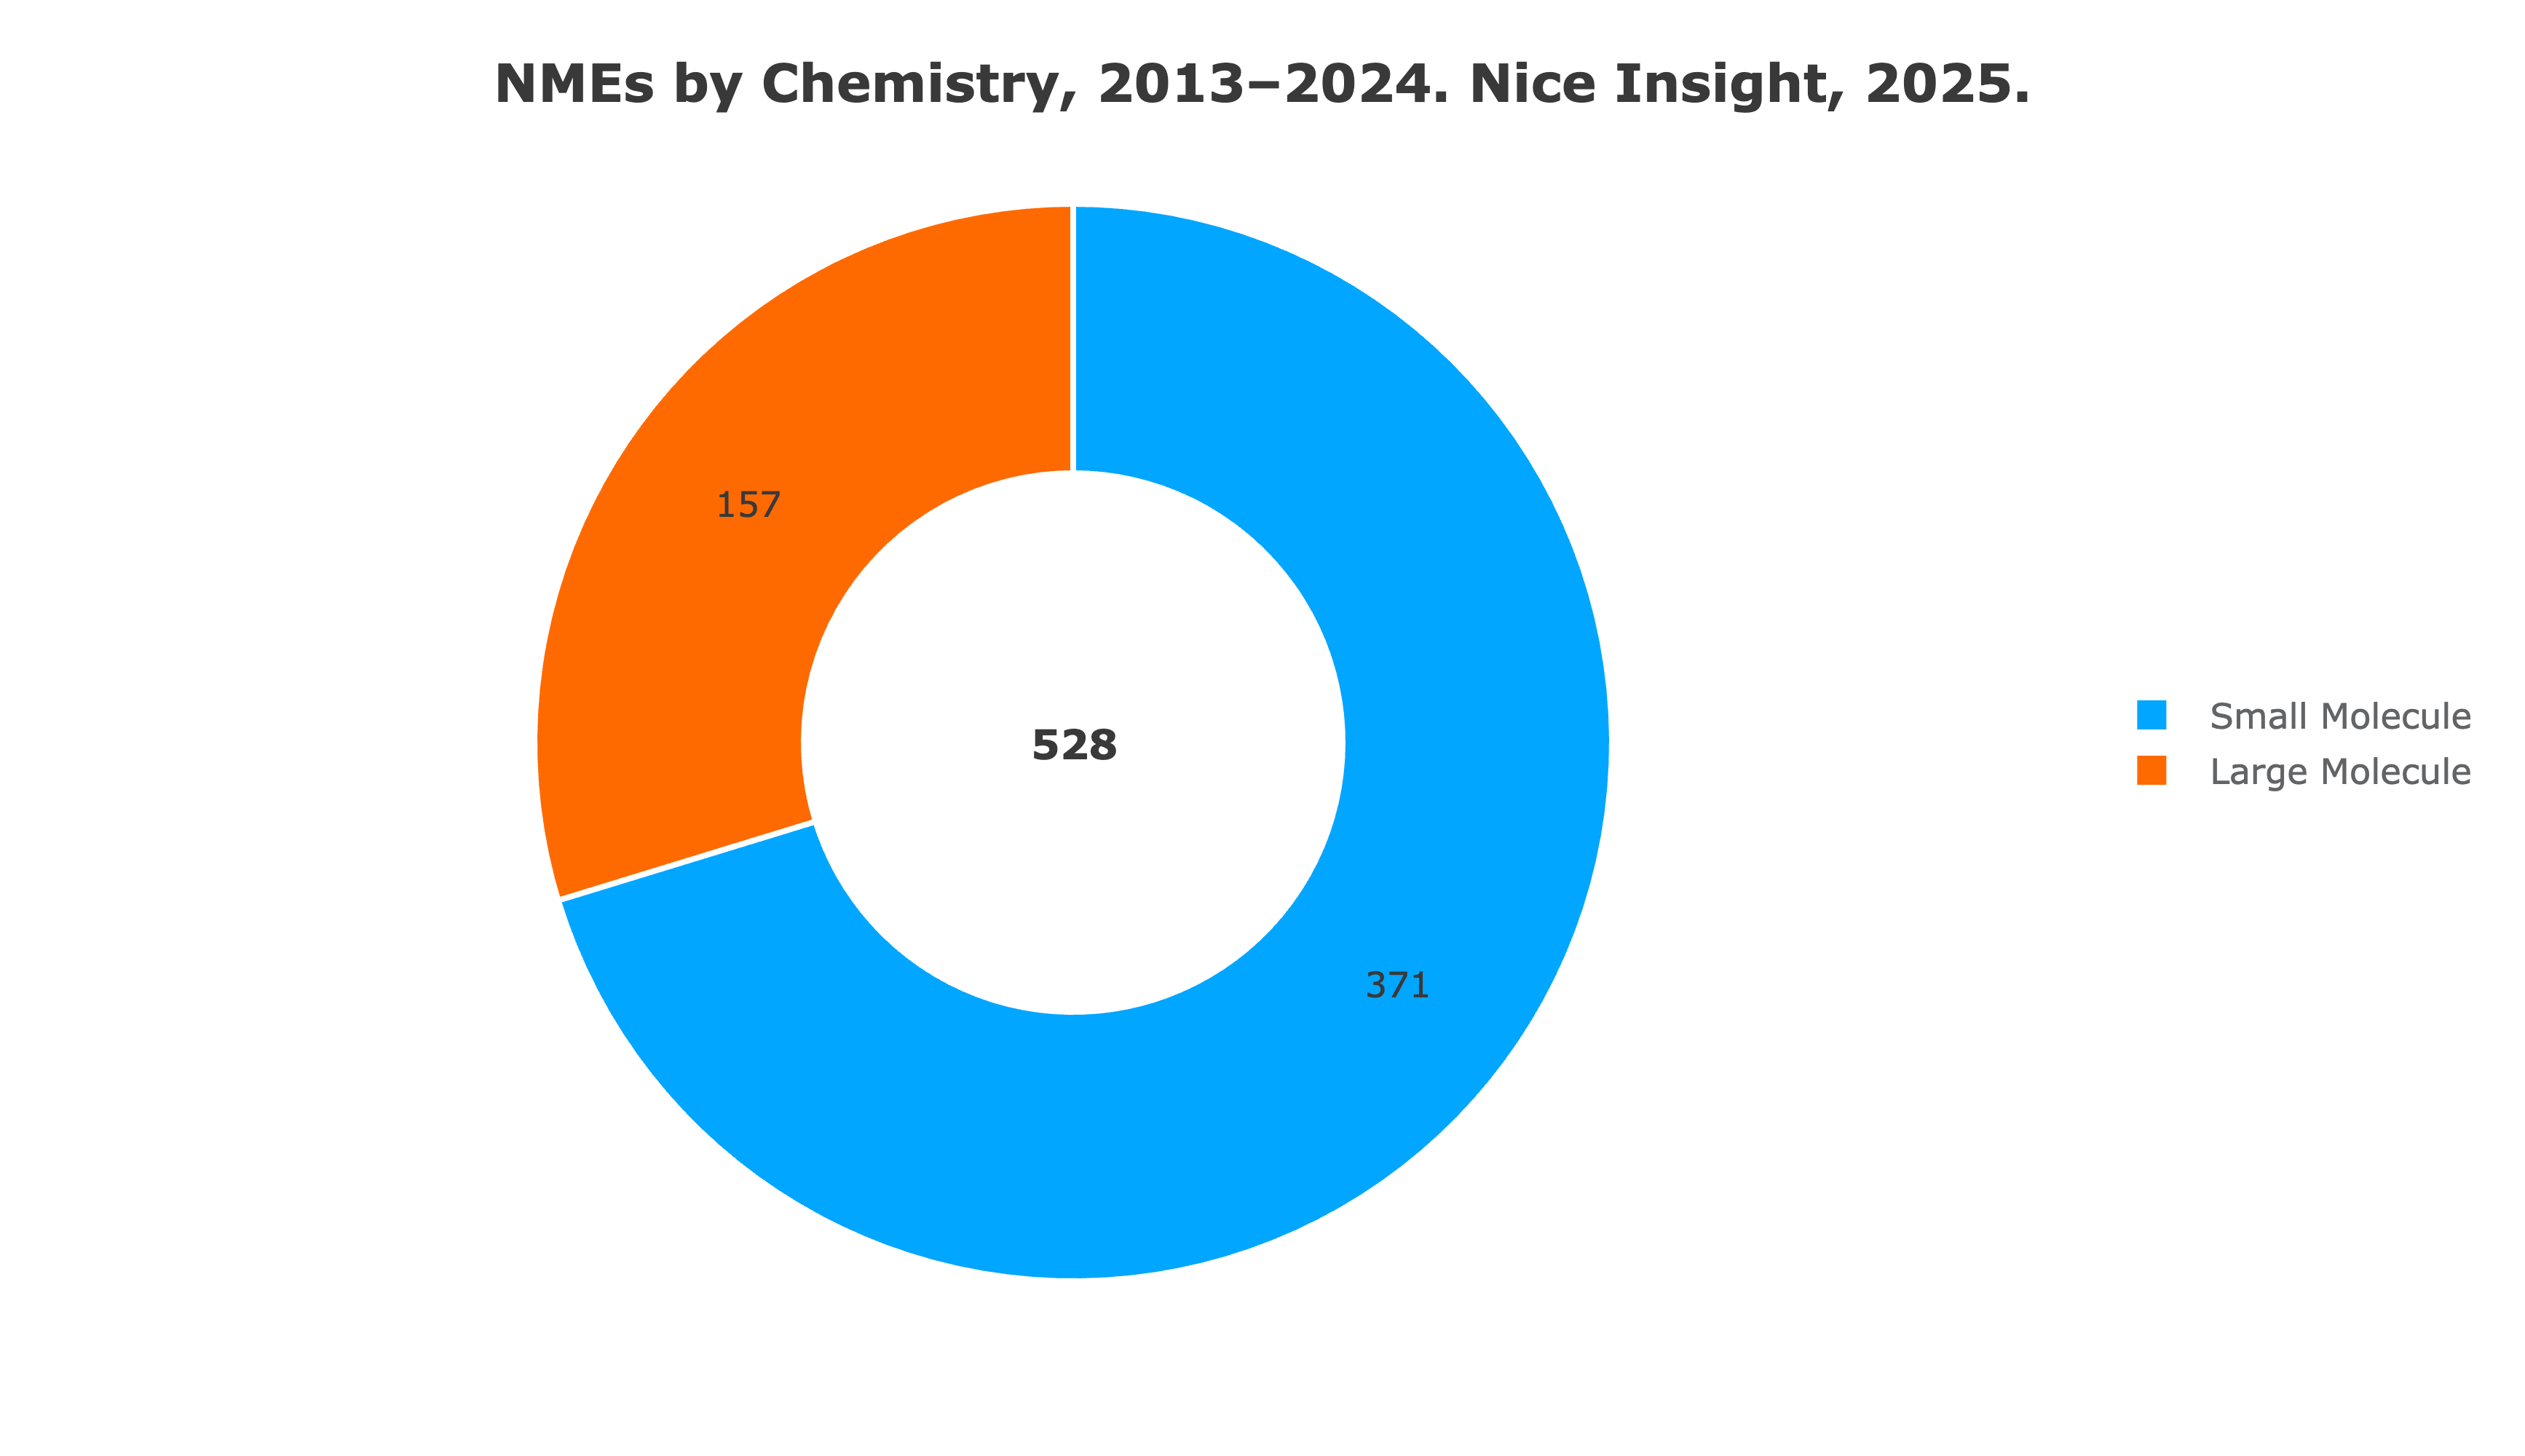 Figure 1. Chemistry of New Drug Approvals, 2013–2024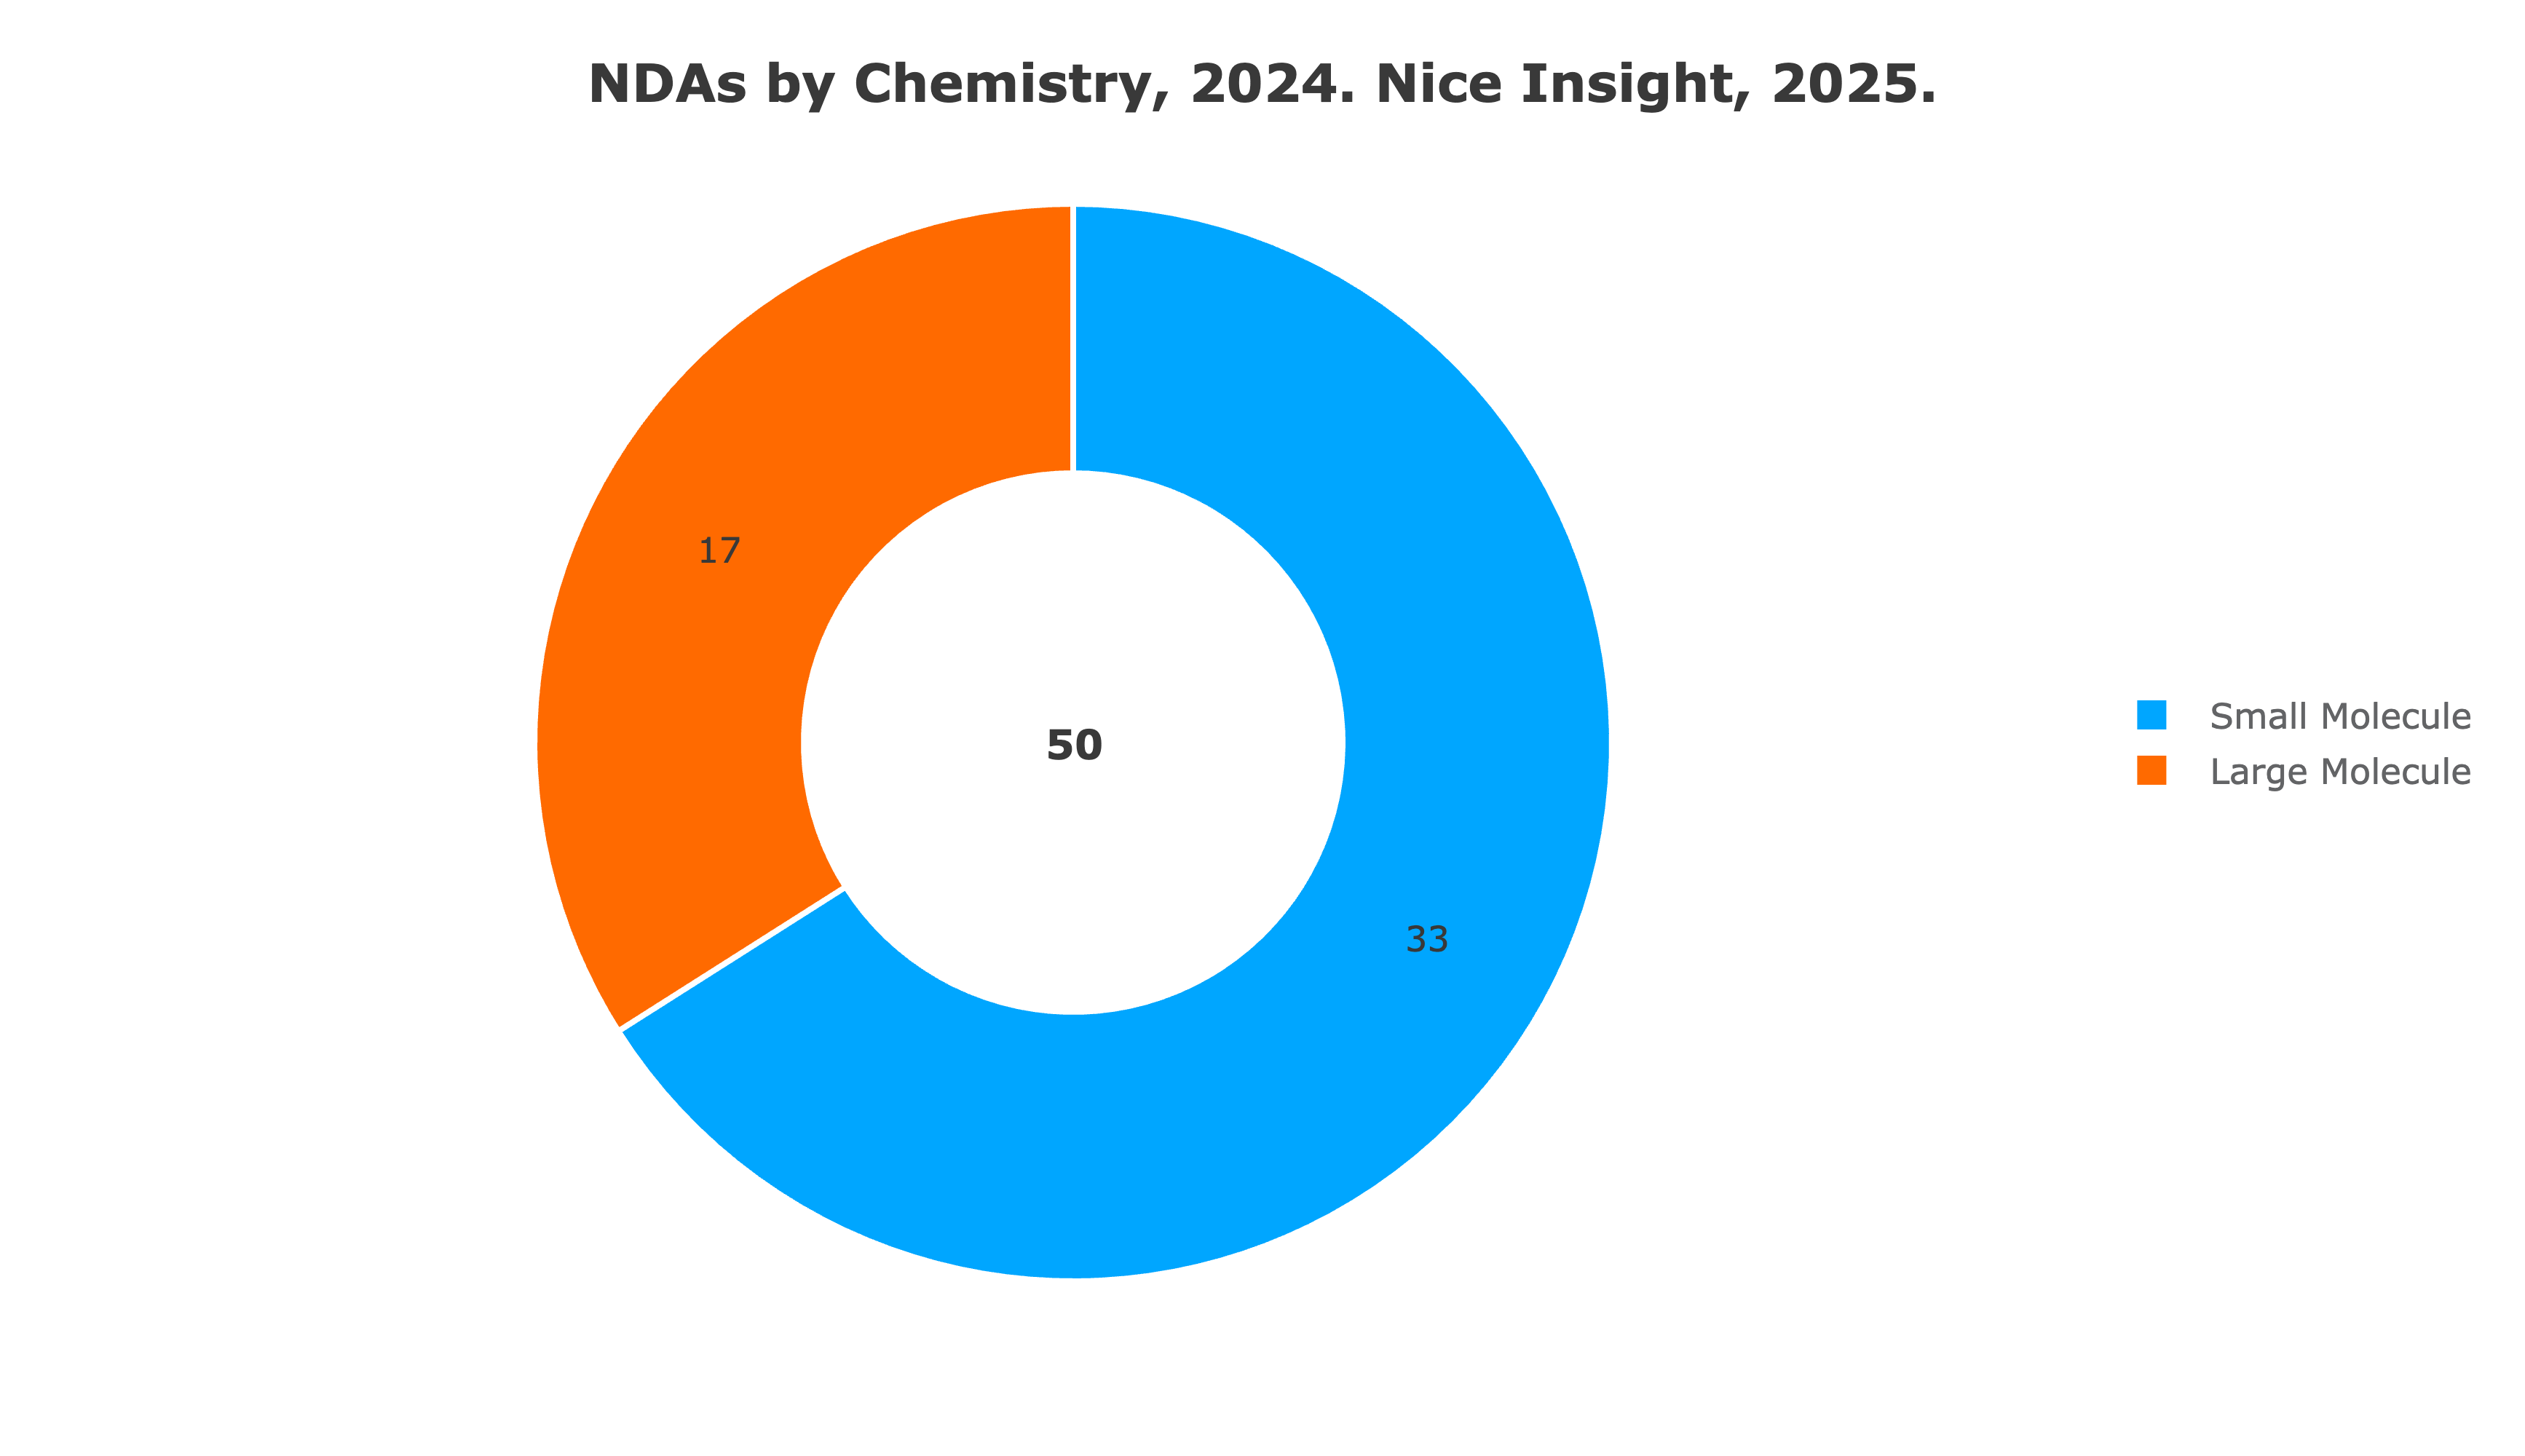
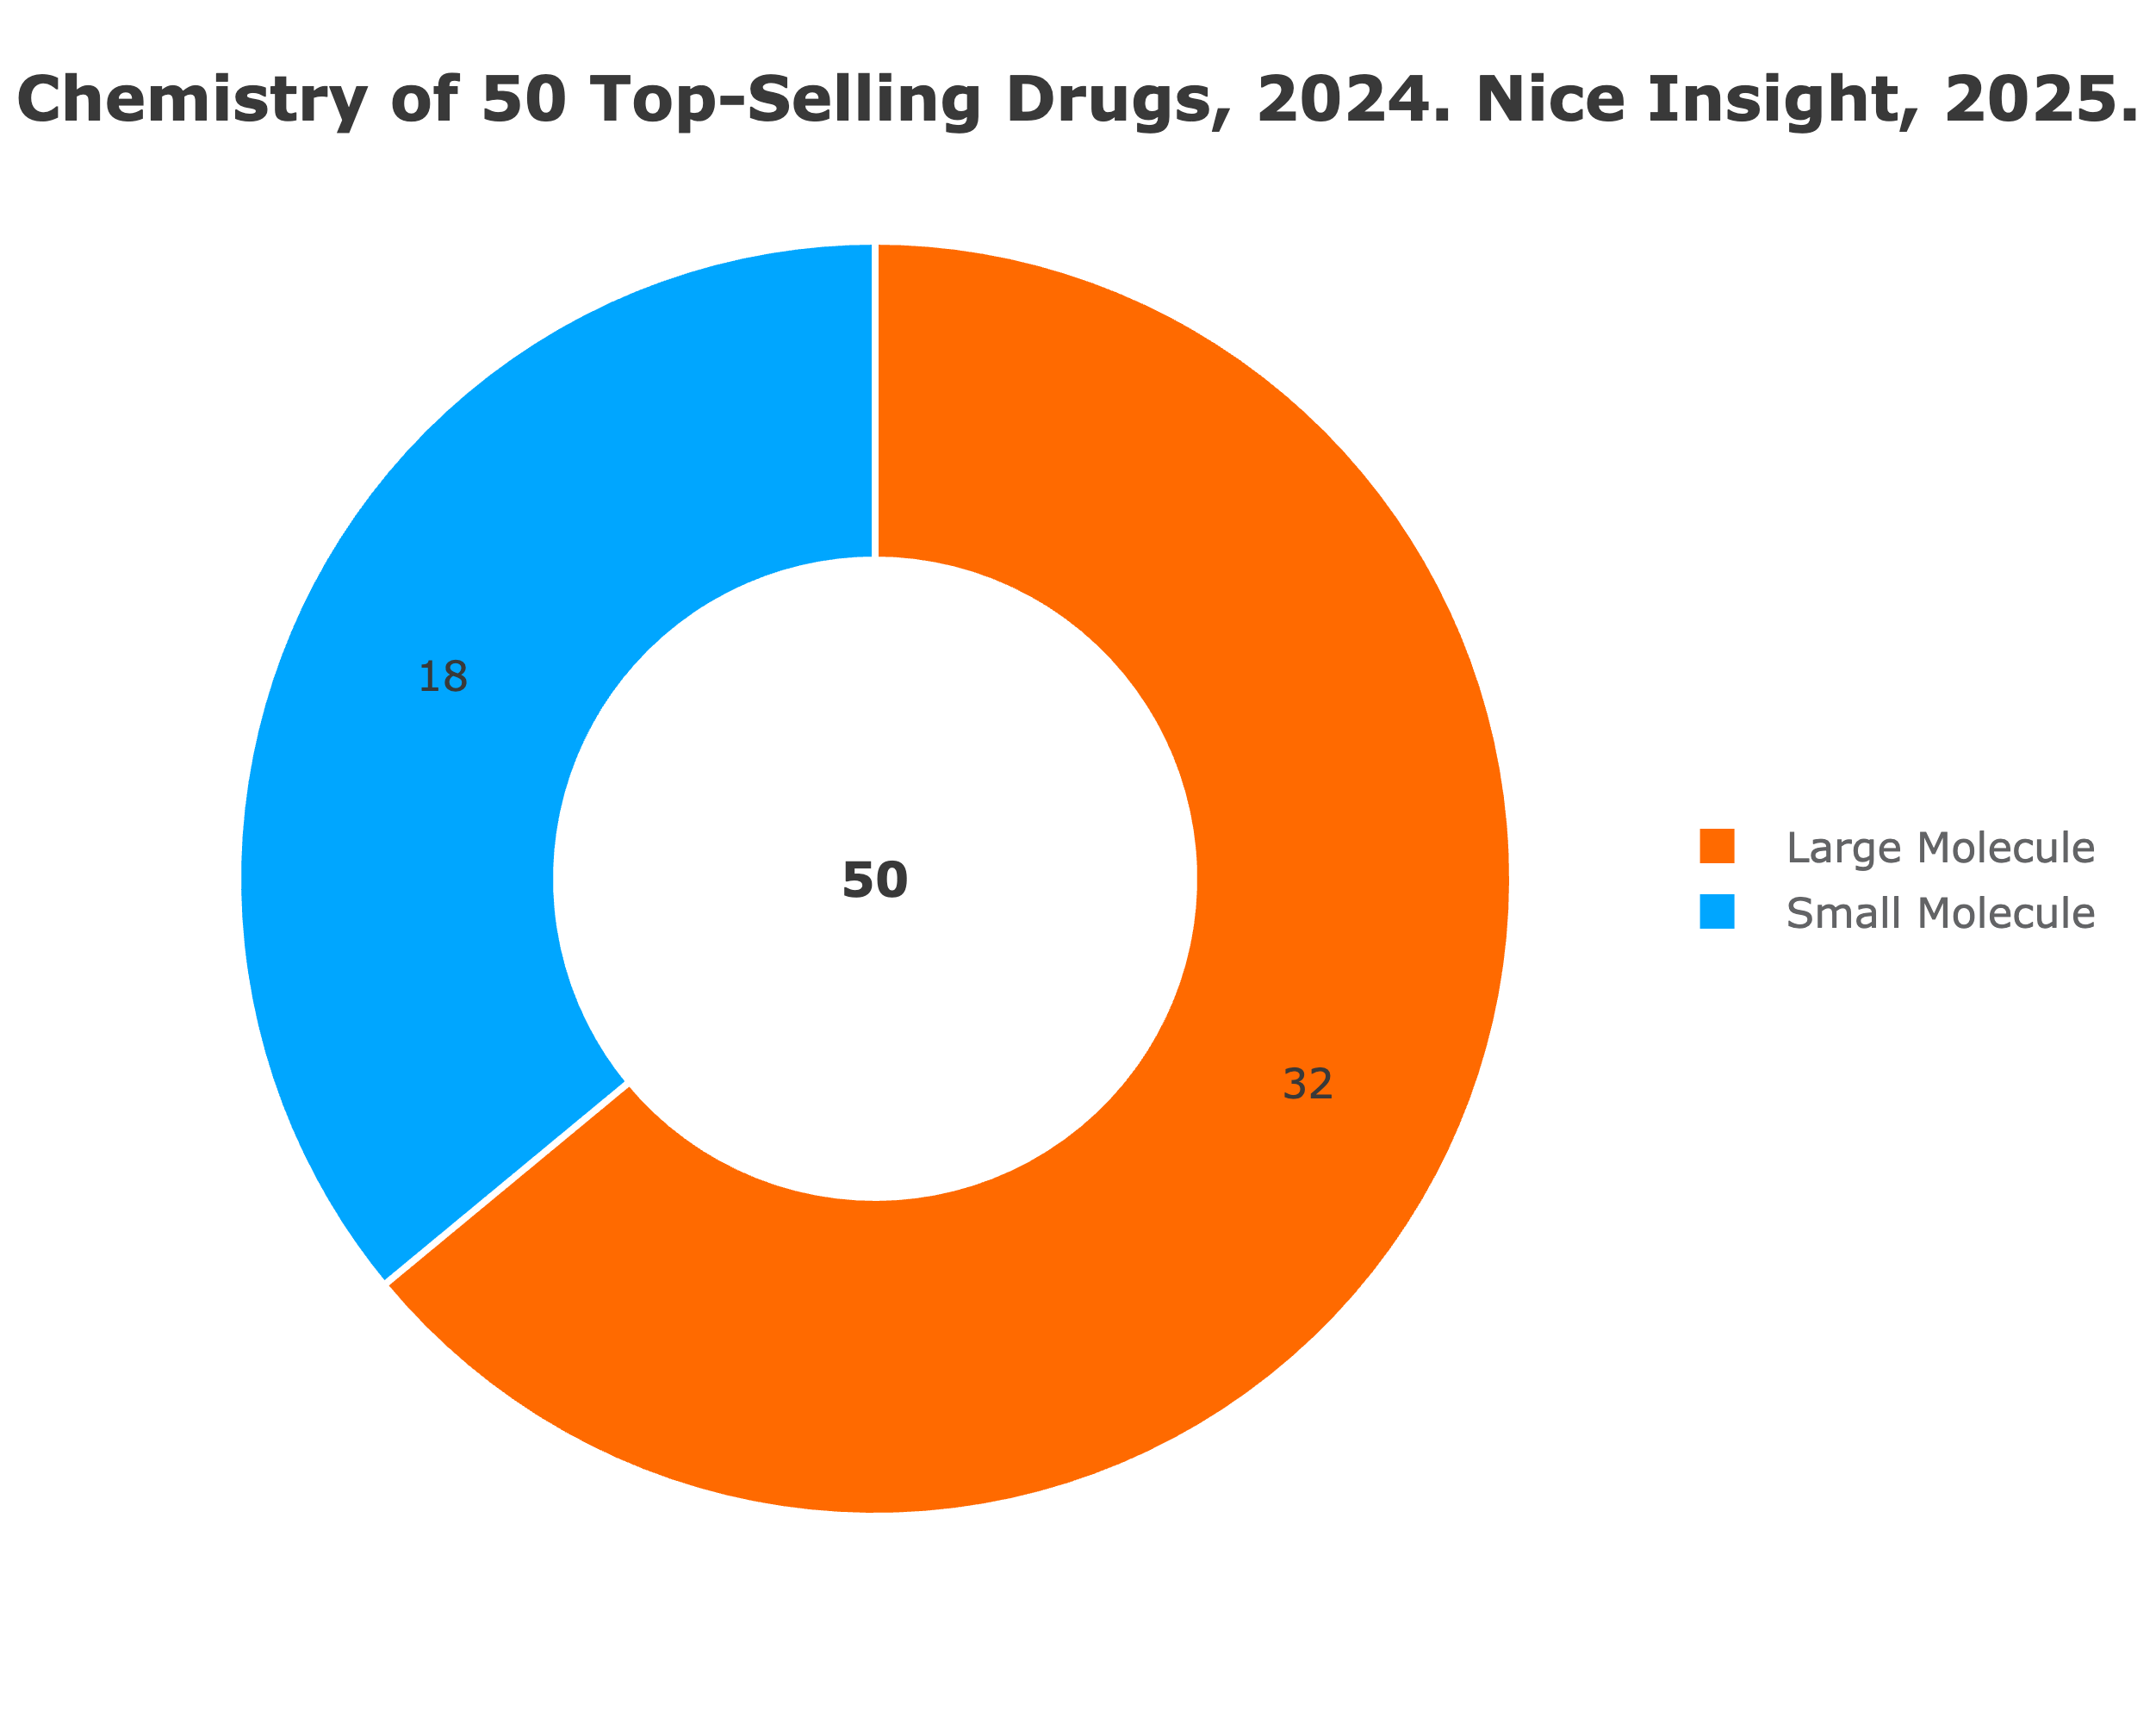 Figure 3. Chemistry of 50 Top-Selling Drugs by Molecule Type, 2024
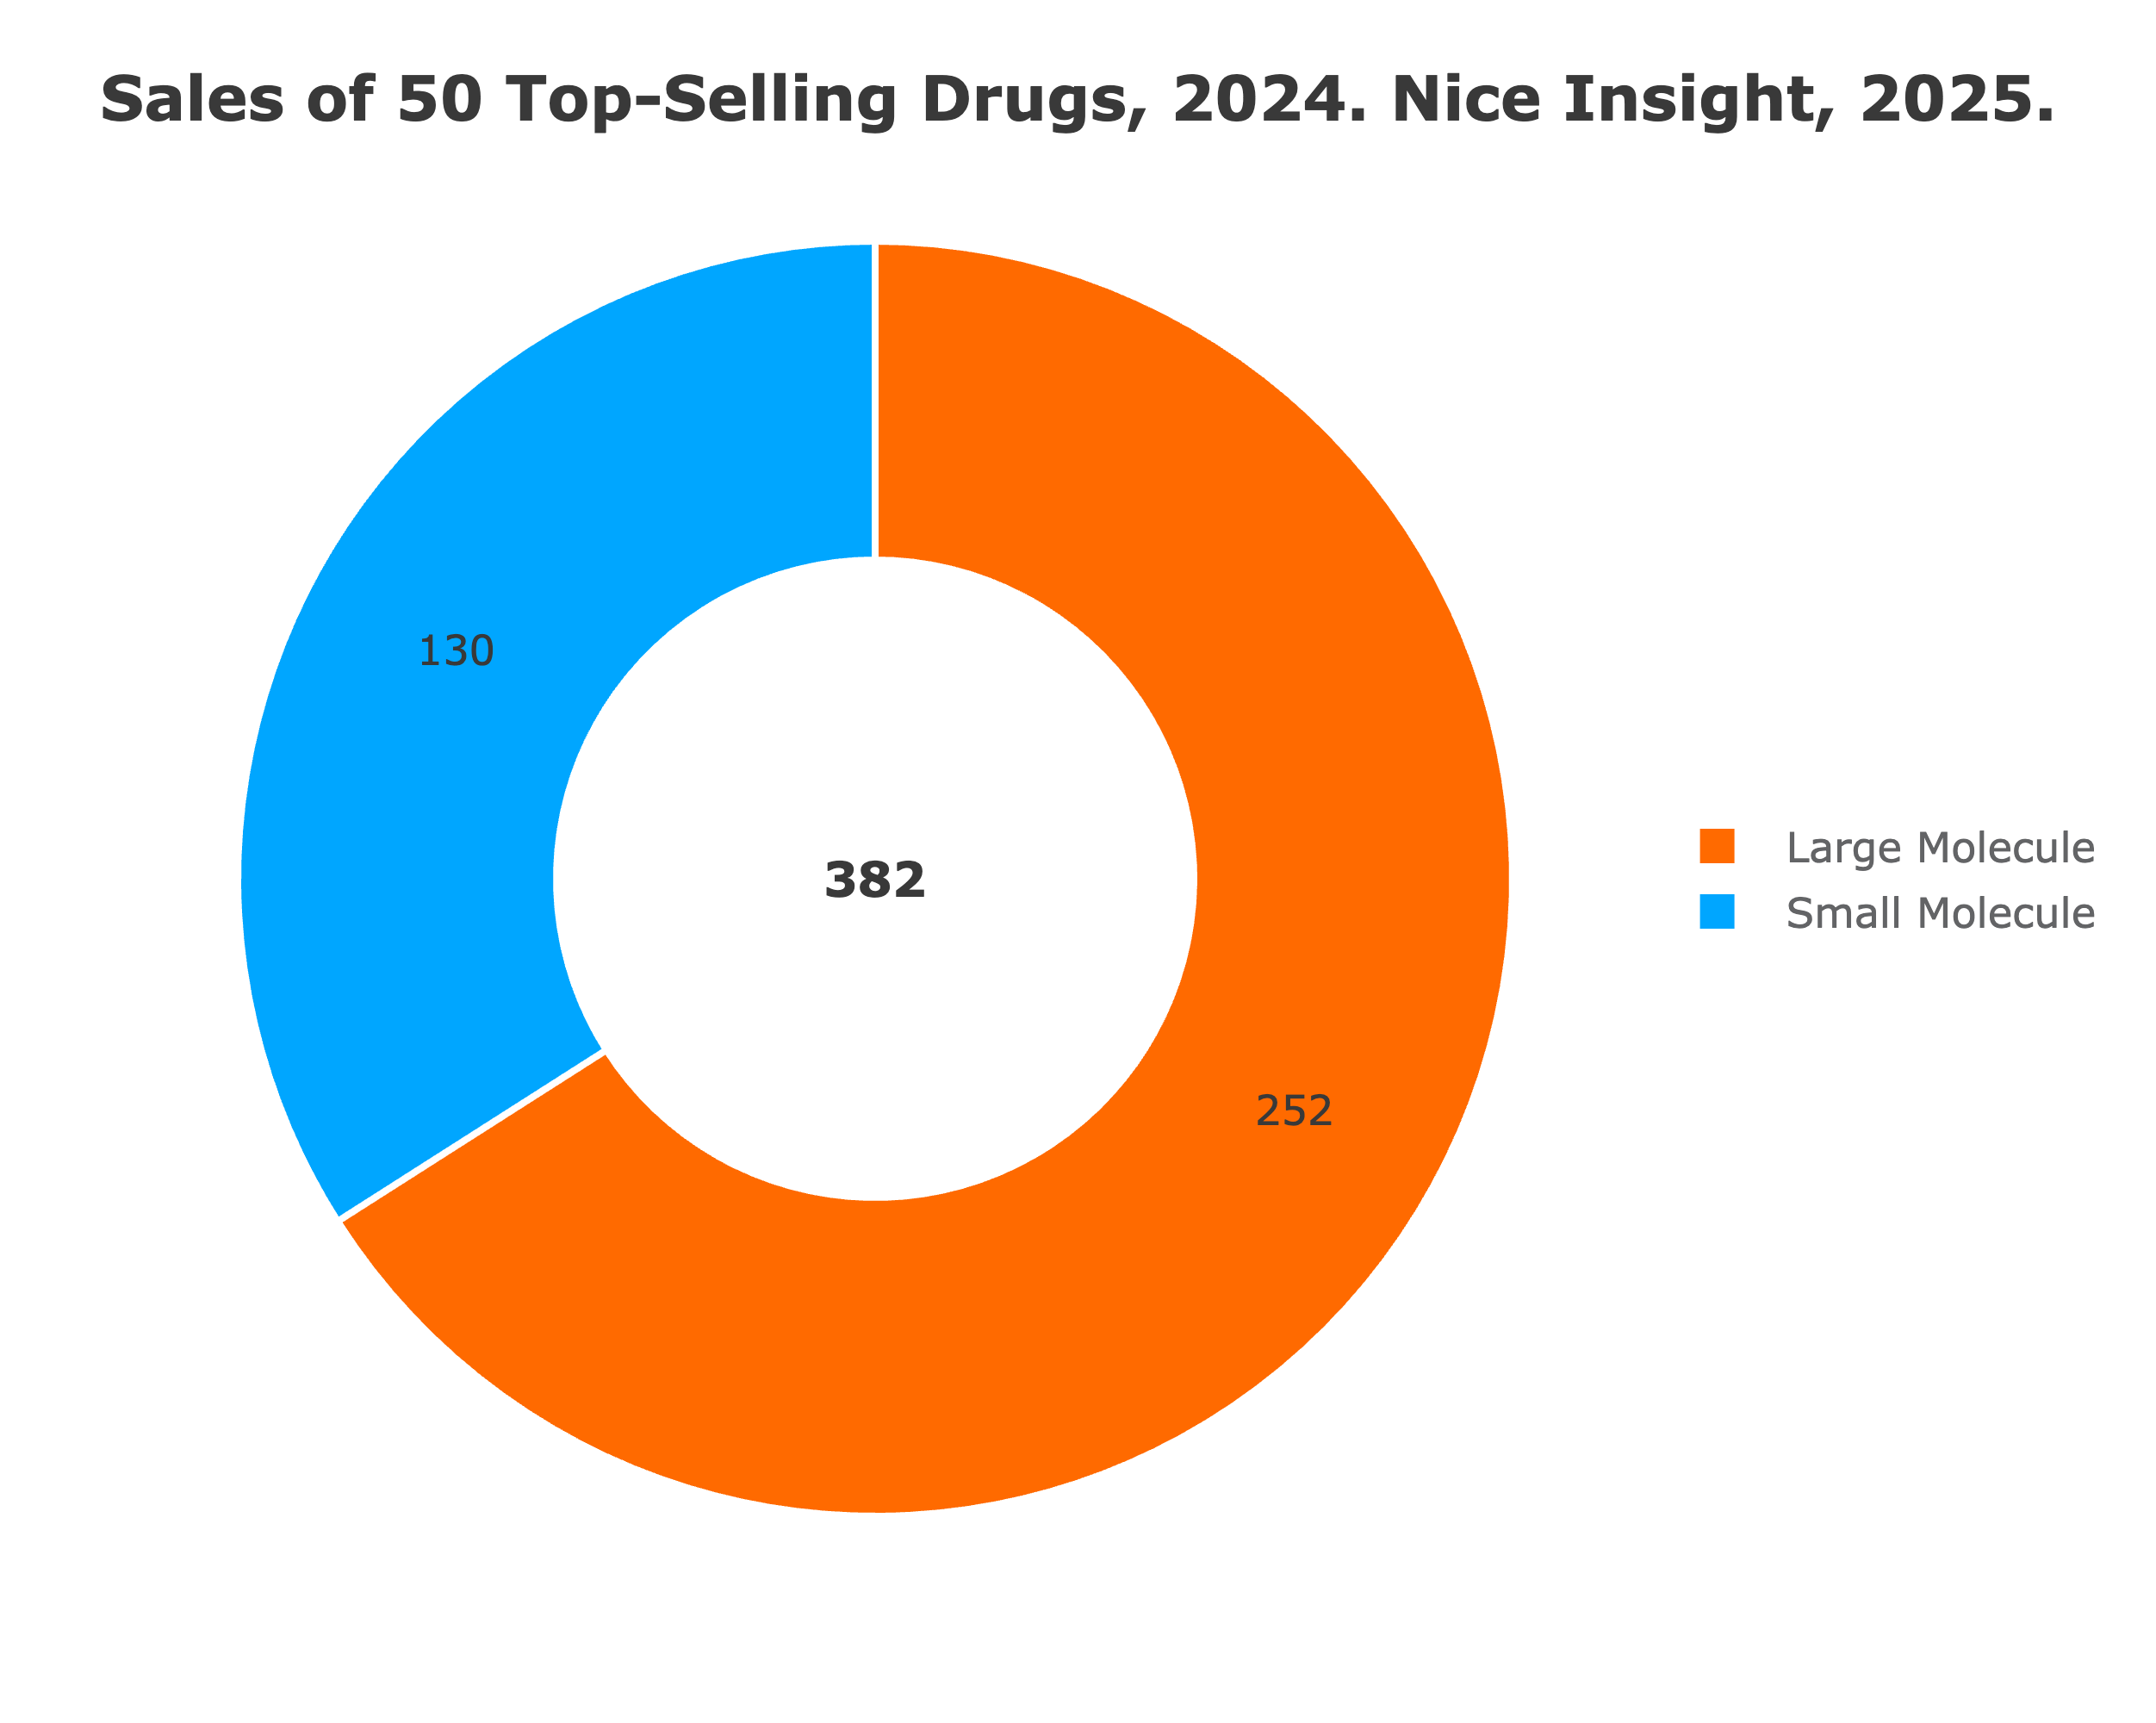 Figure 4. Sales of Top 50 Drugs of 2024 by Molecule Class
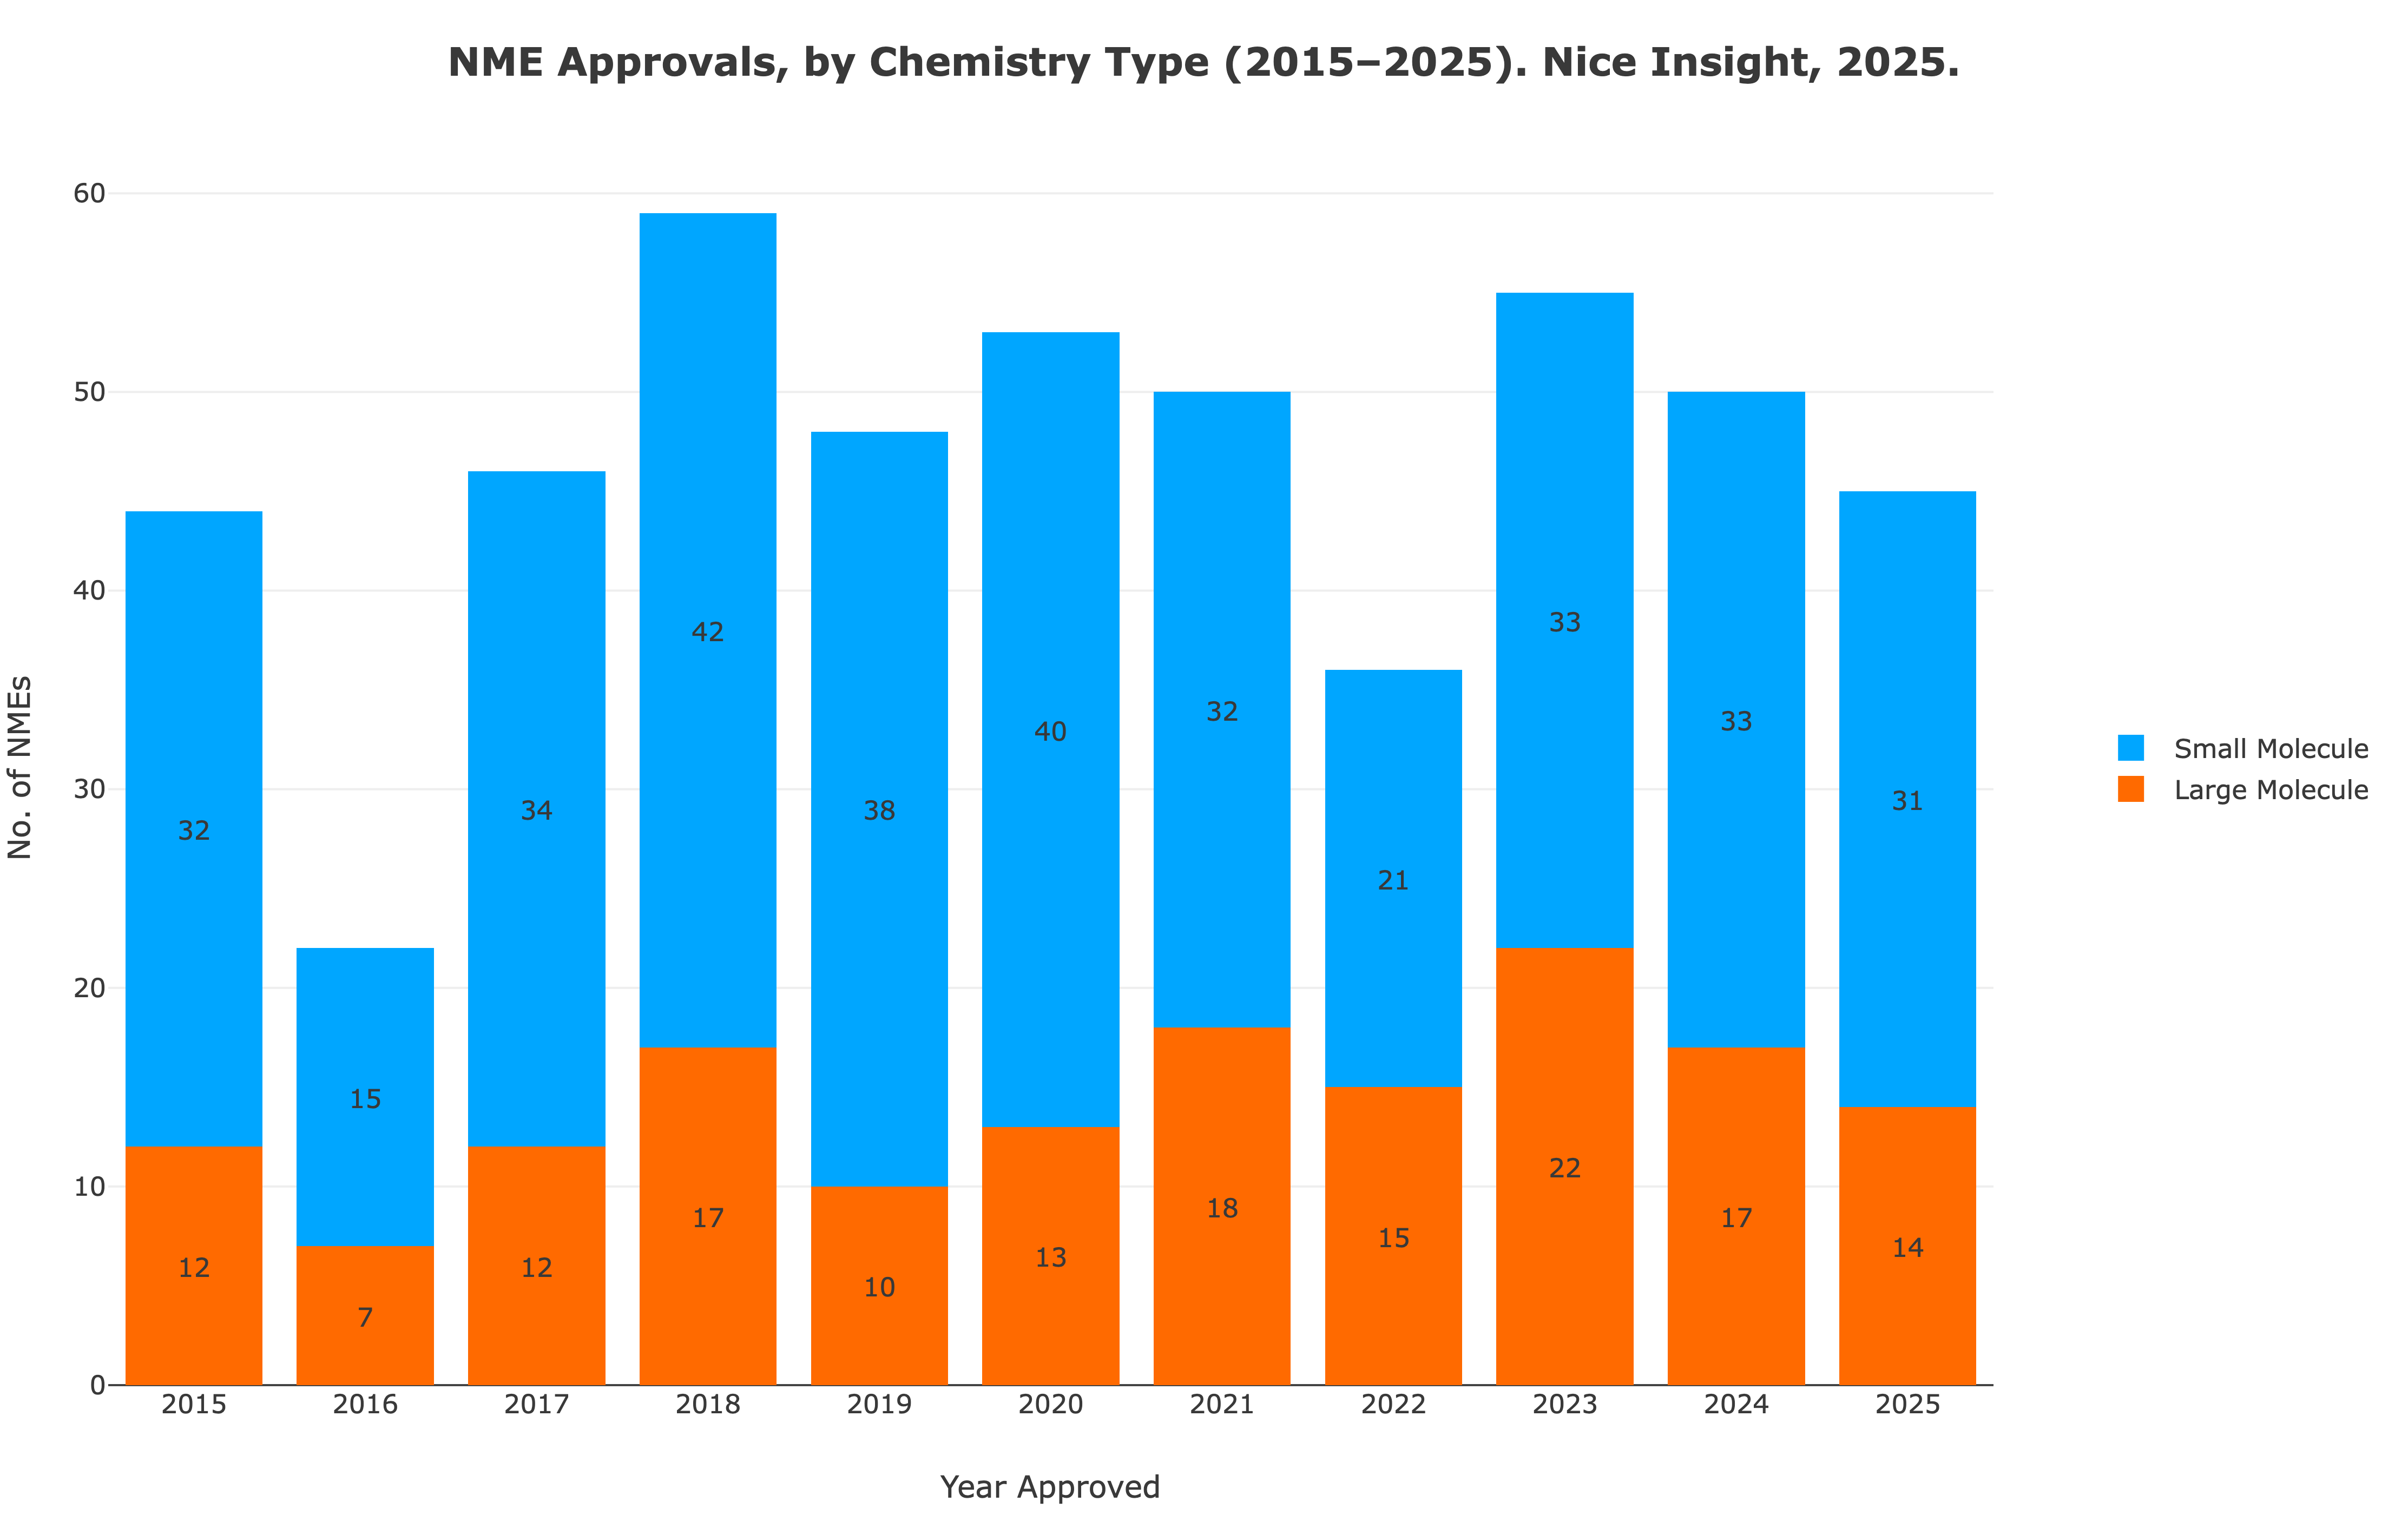 Figure 5. Chemistry of New Drug Approvals Annually, 2013–2025
 Analysis by Nice Insight, March 2025.
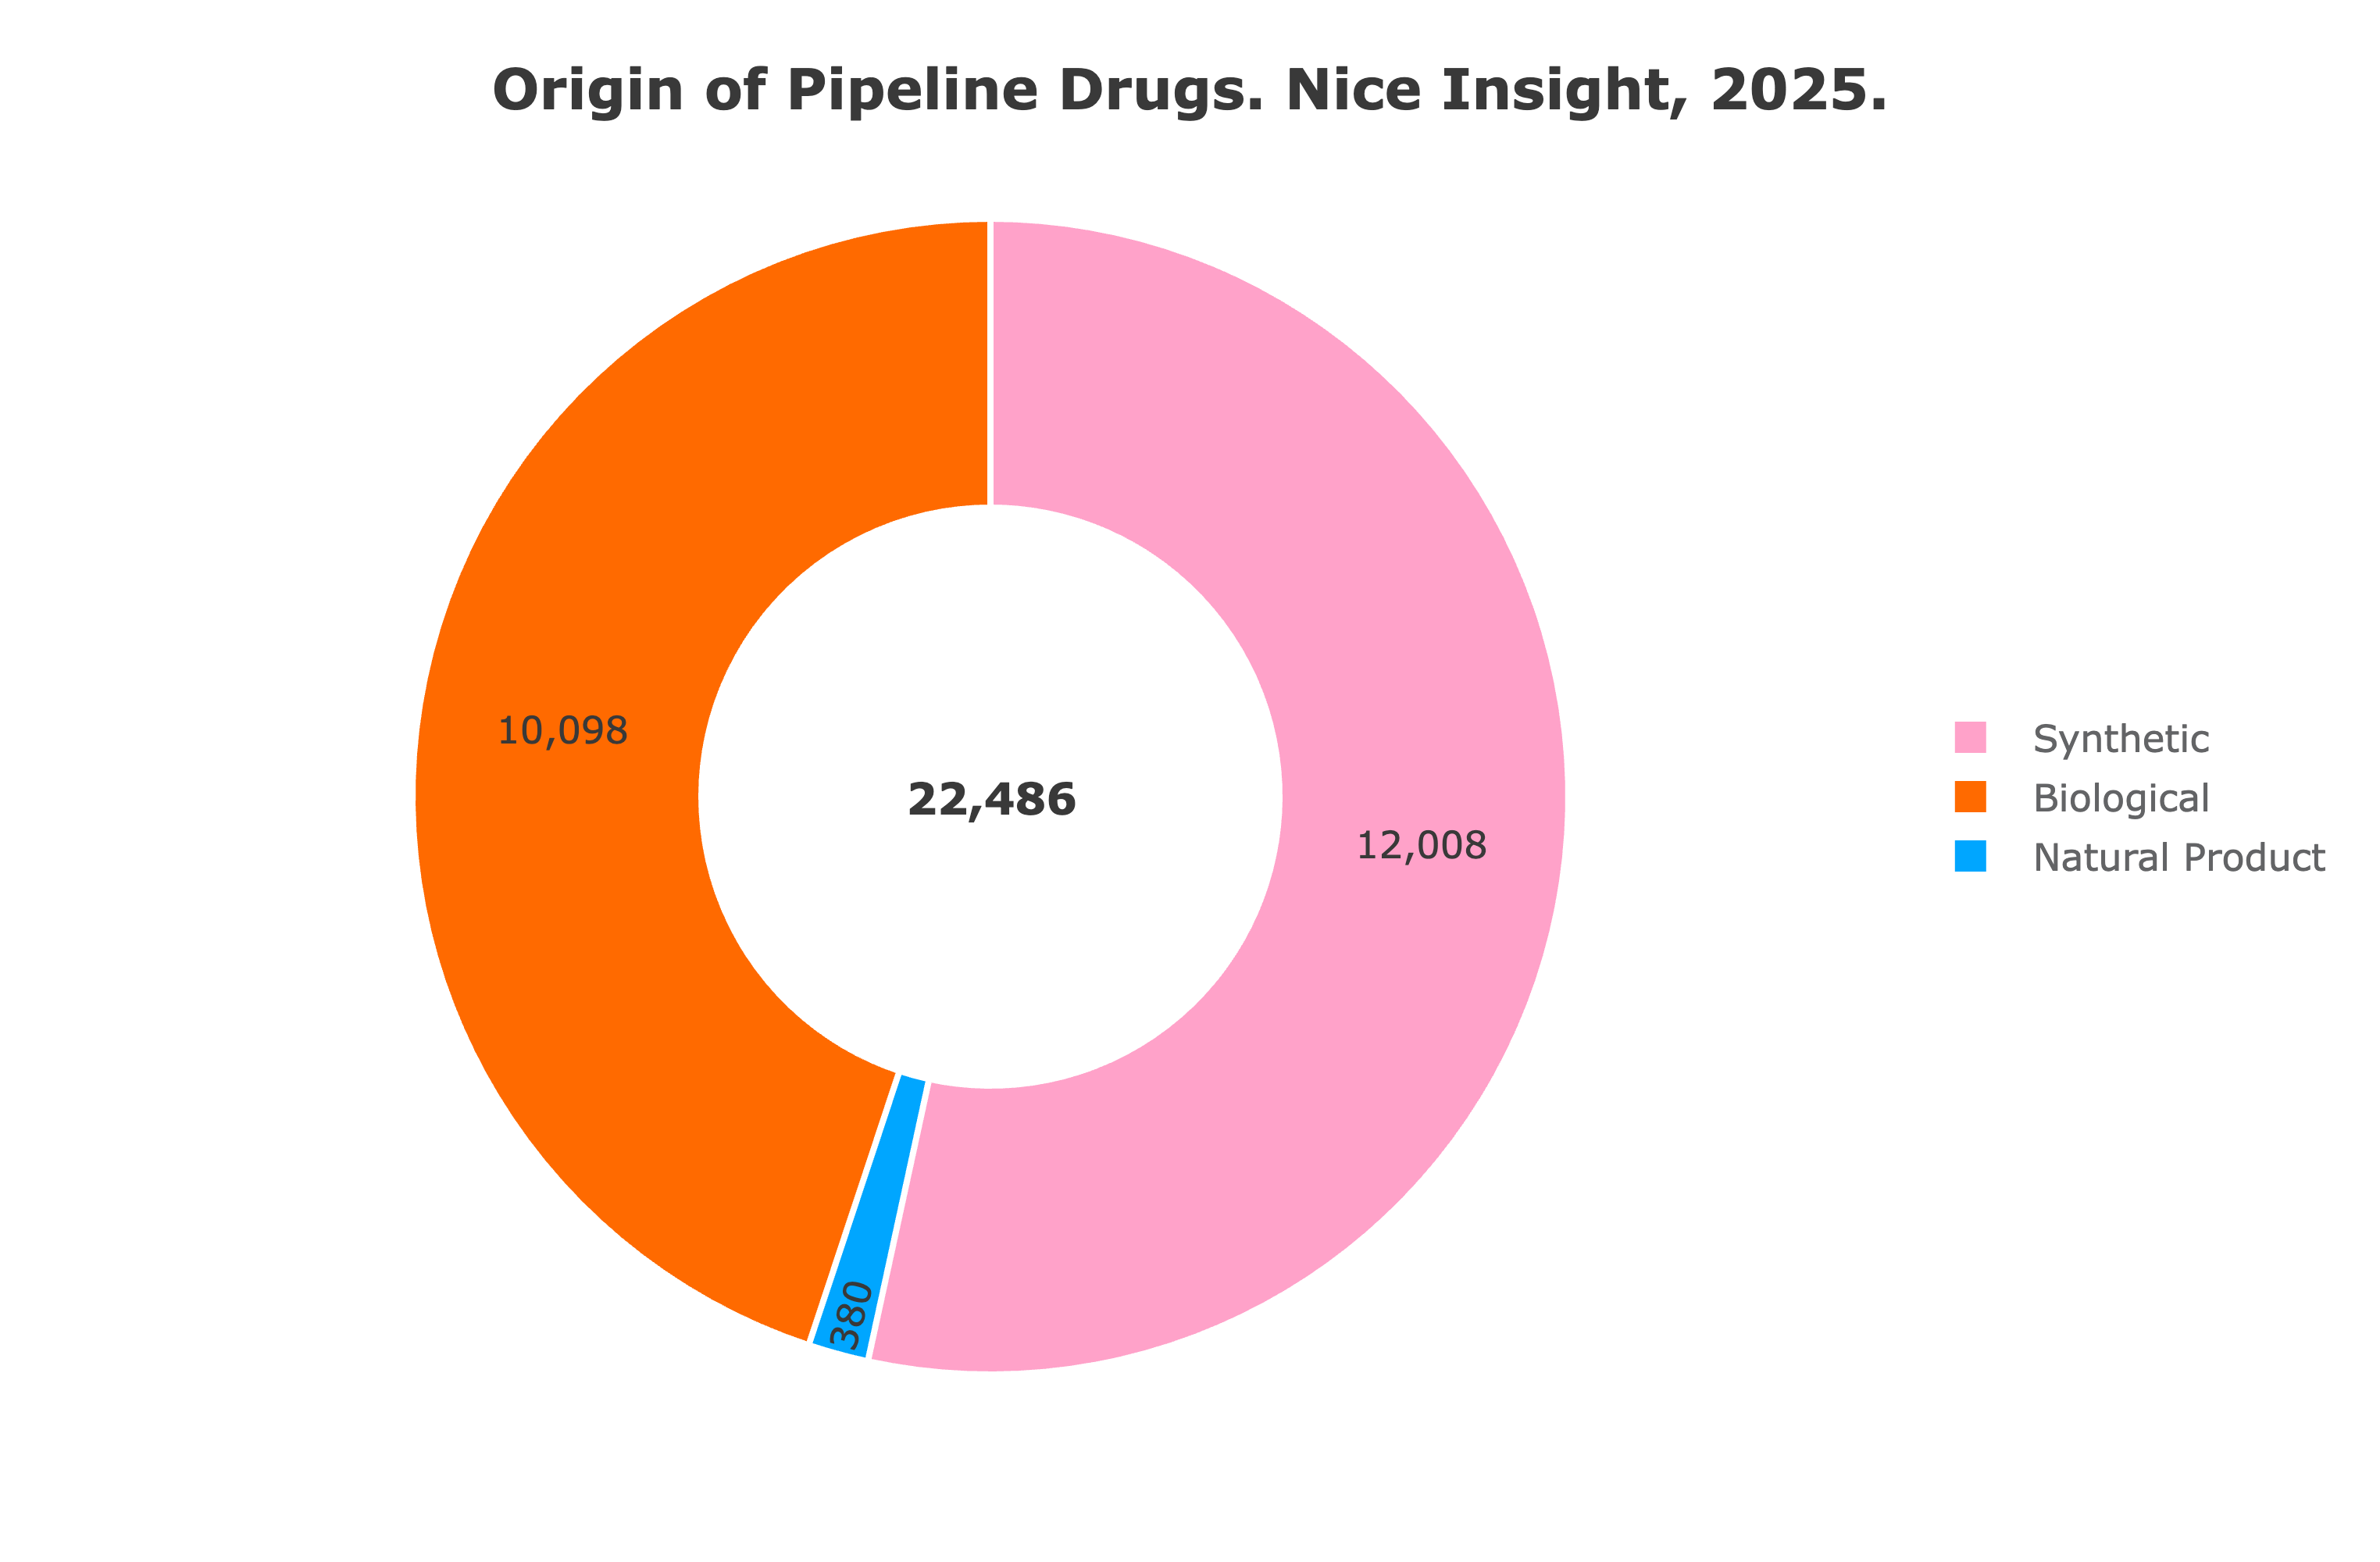 Figure 6. Origin of Pipeline Drugs
 Source: Citeline[2]; Nice Insight 2024
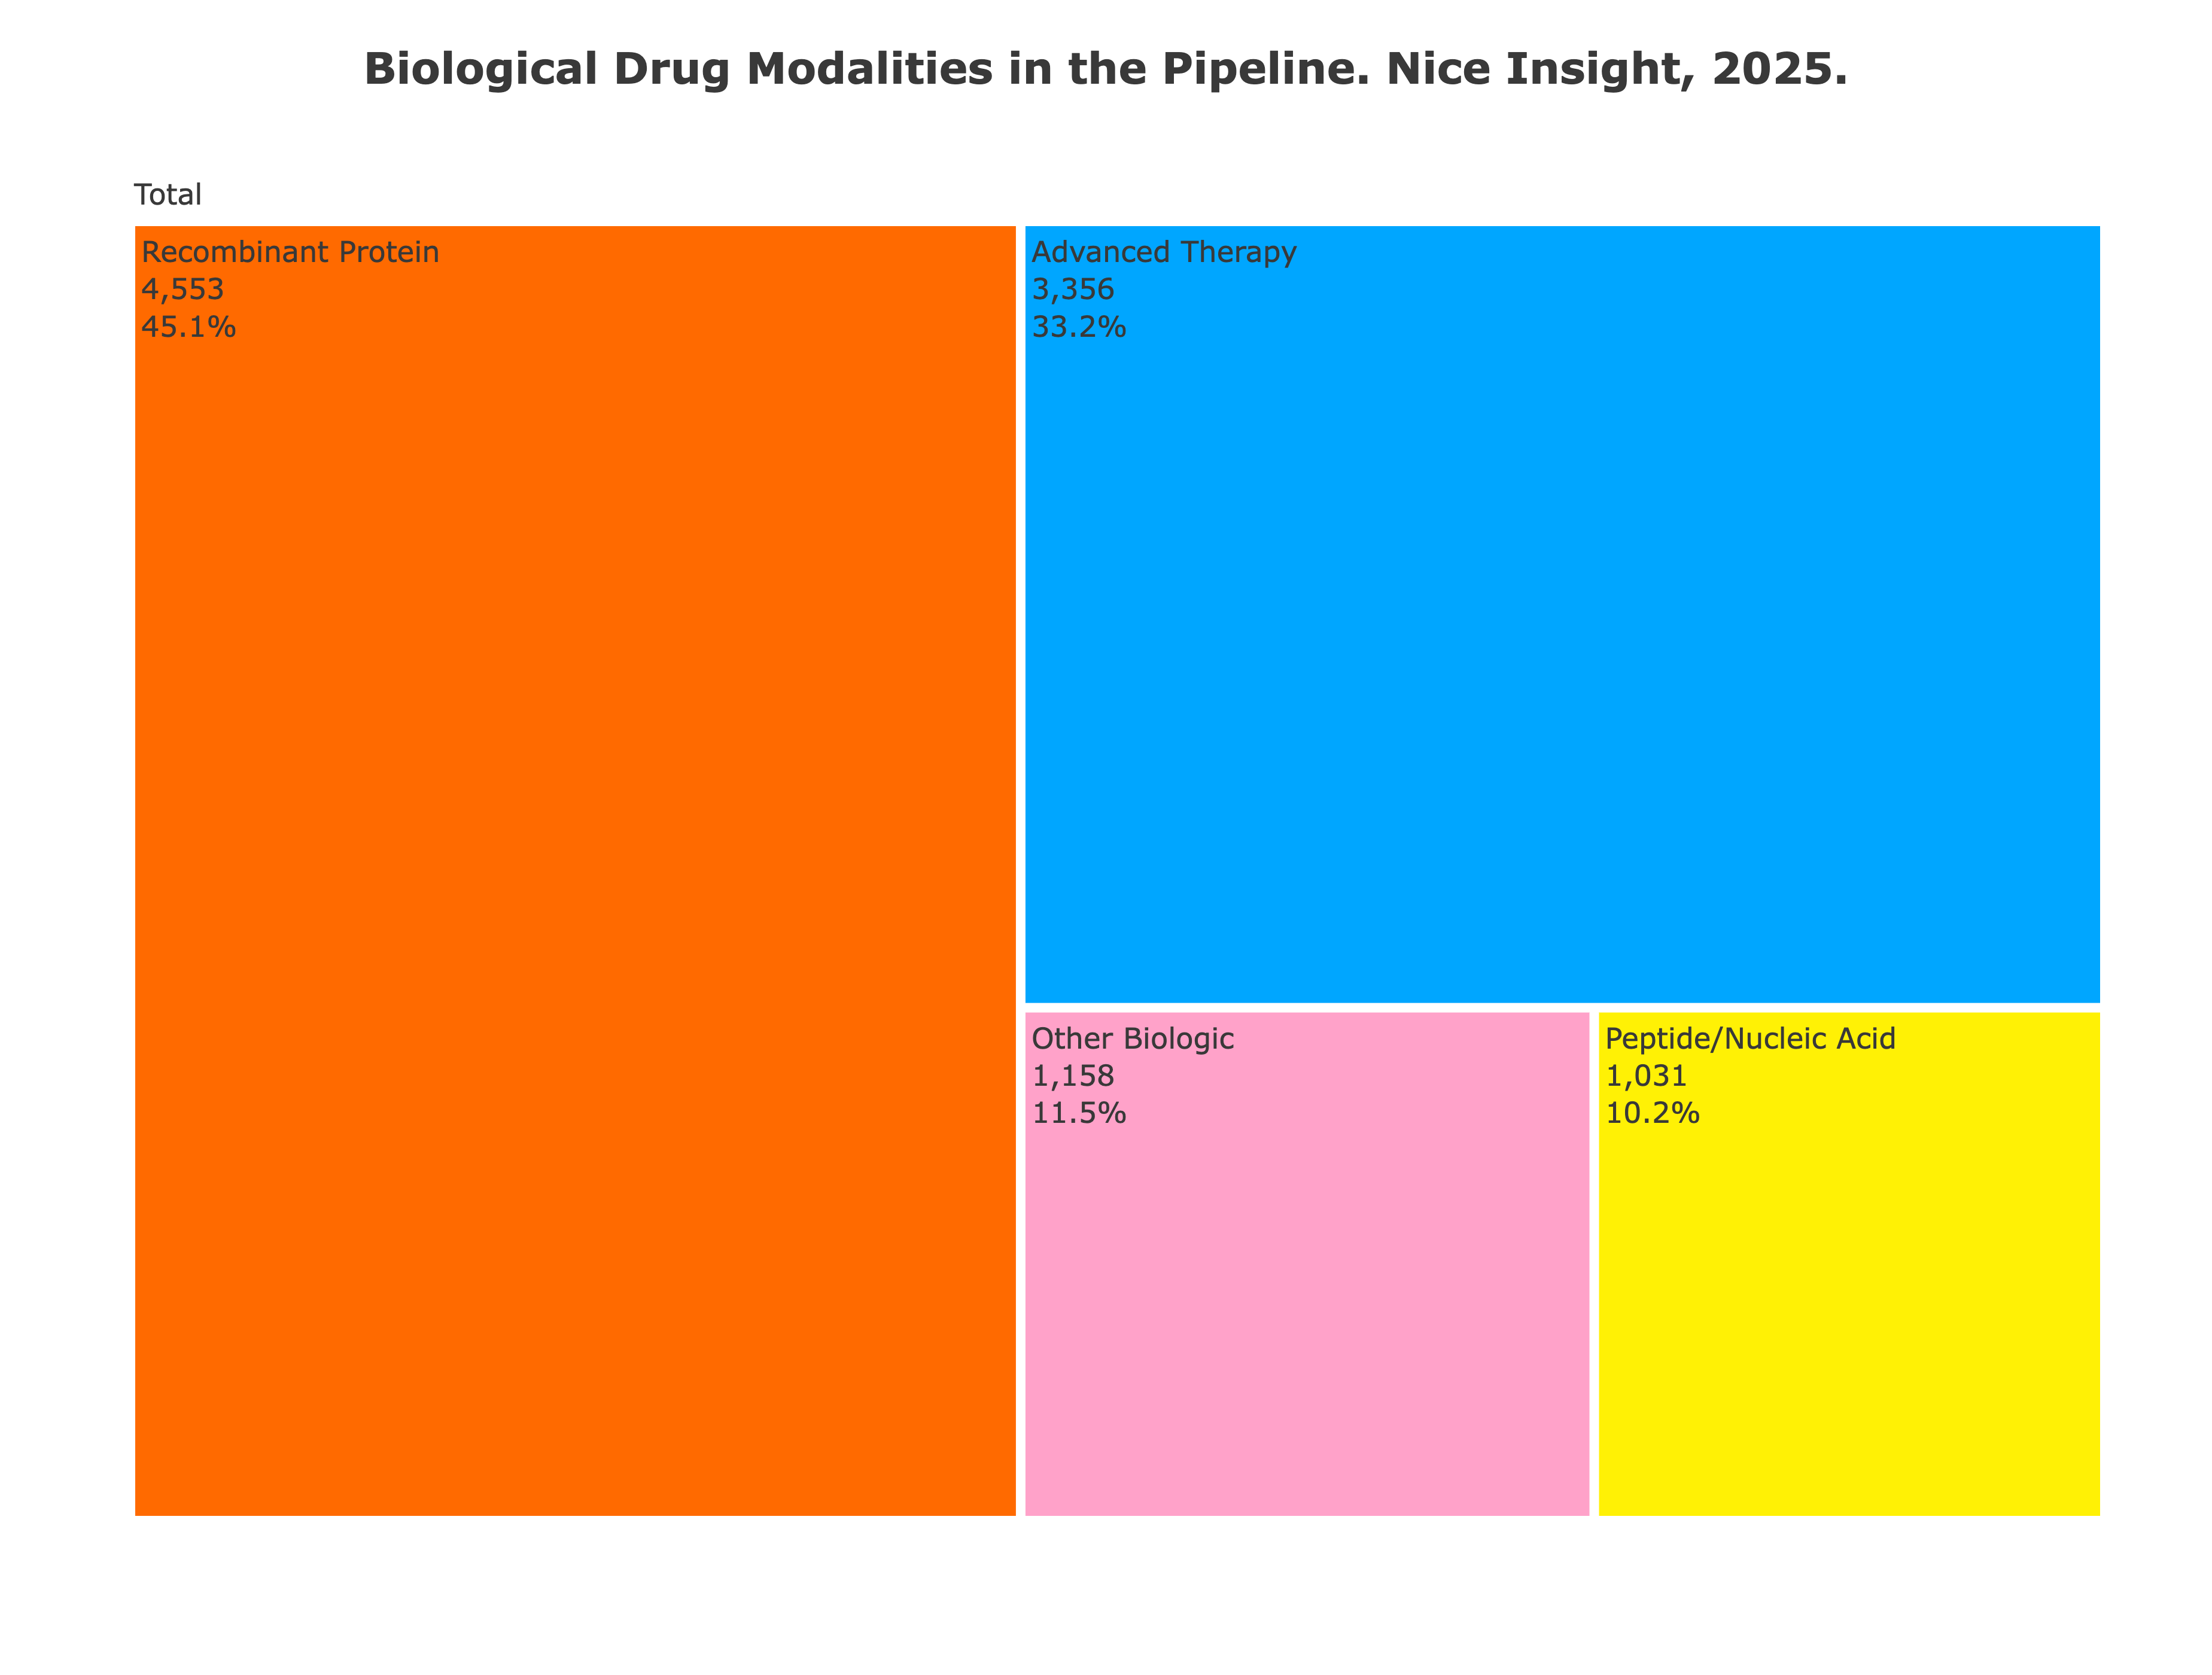 Figure 7. Classes of Biological Drugs in the Pipeline
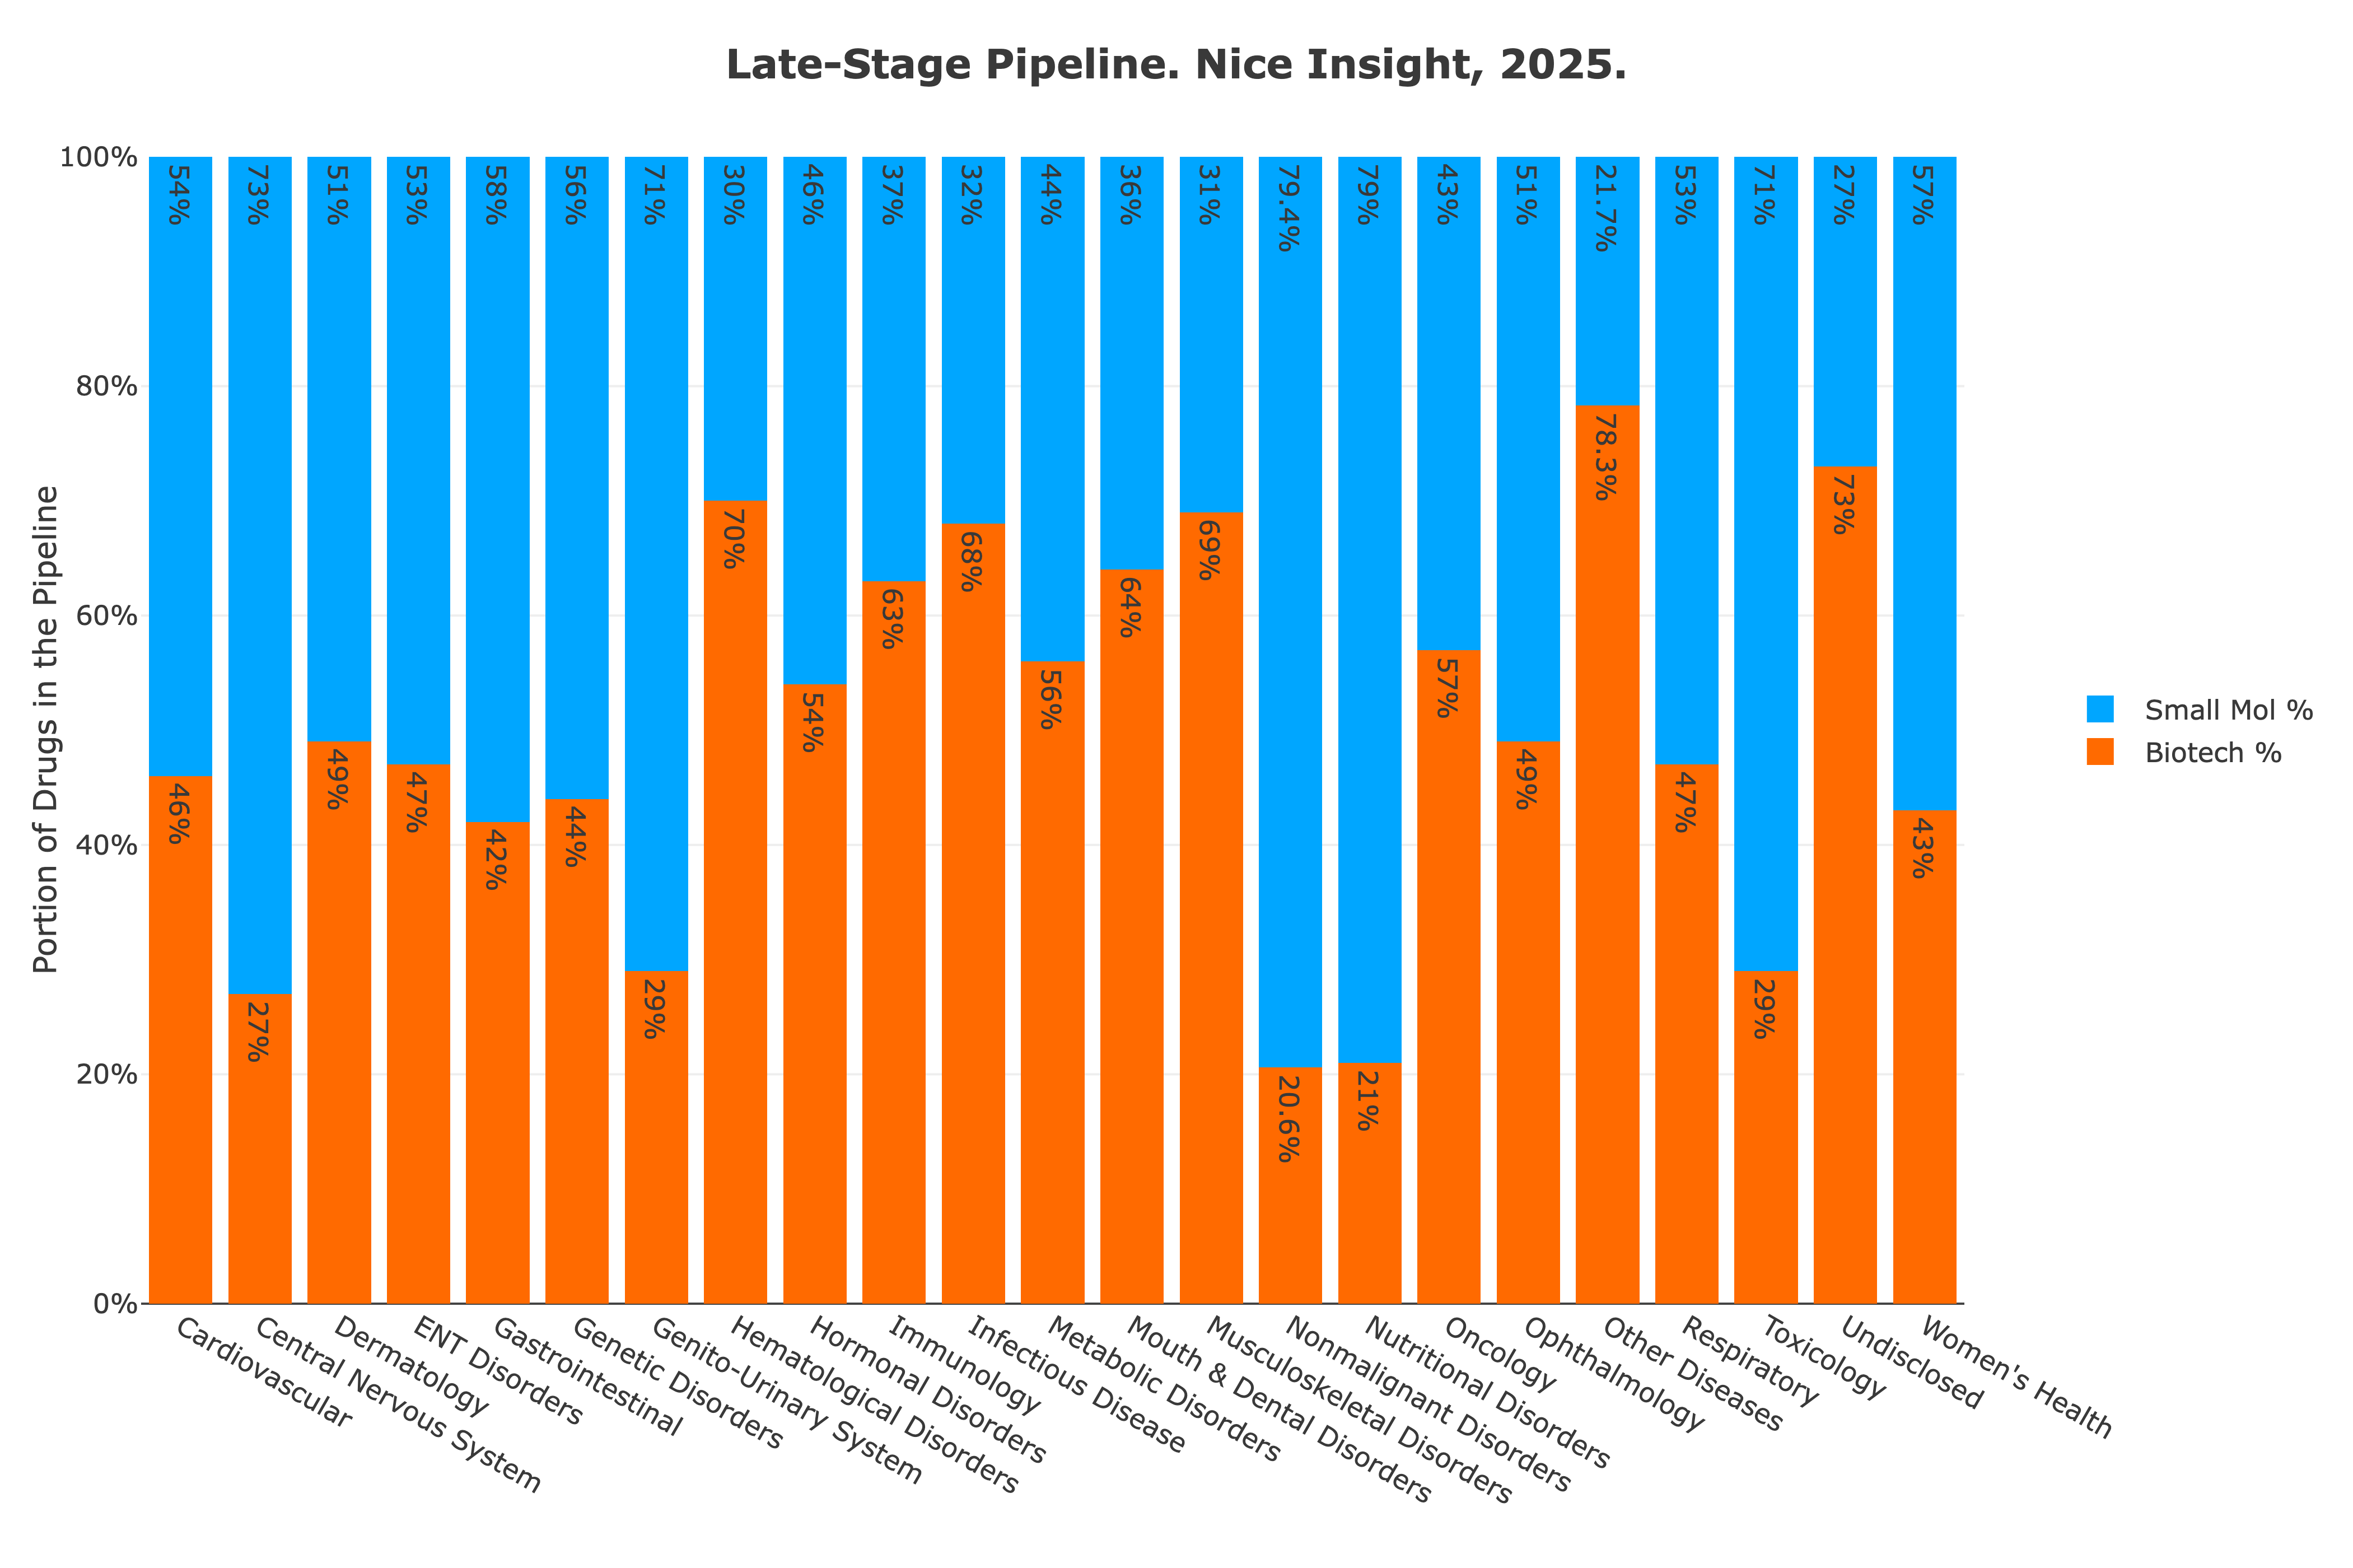 Figure 8. Late-Stage Pipeline: Portion of Each Molecule Class by Indication
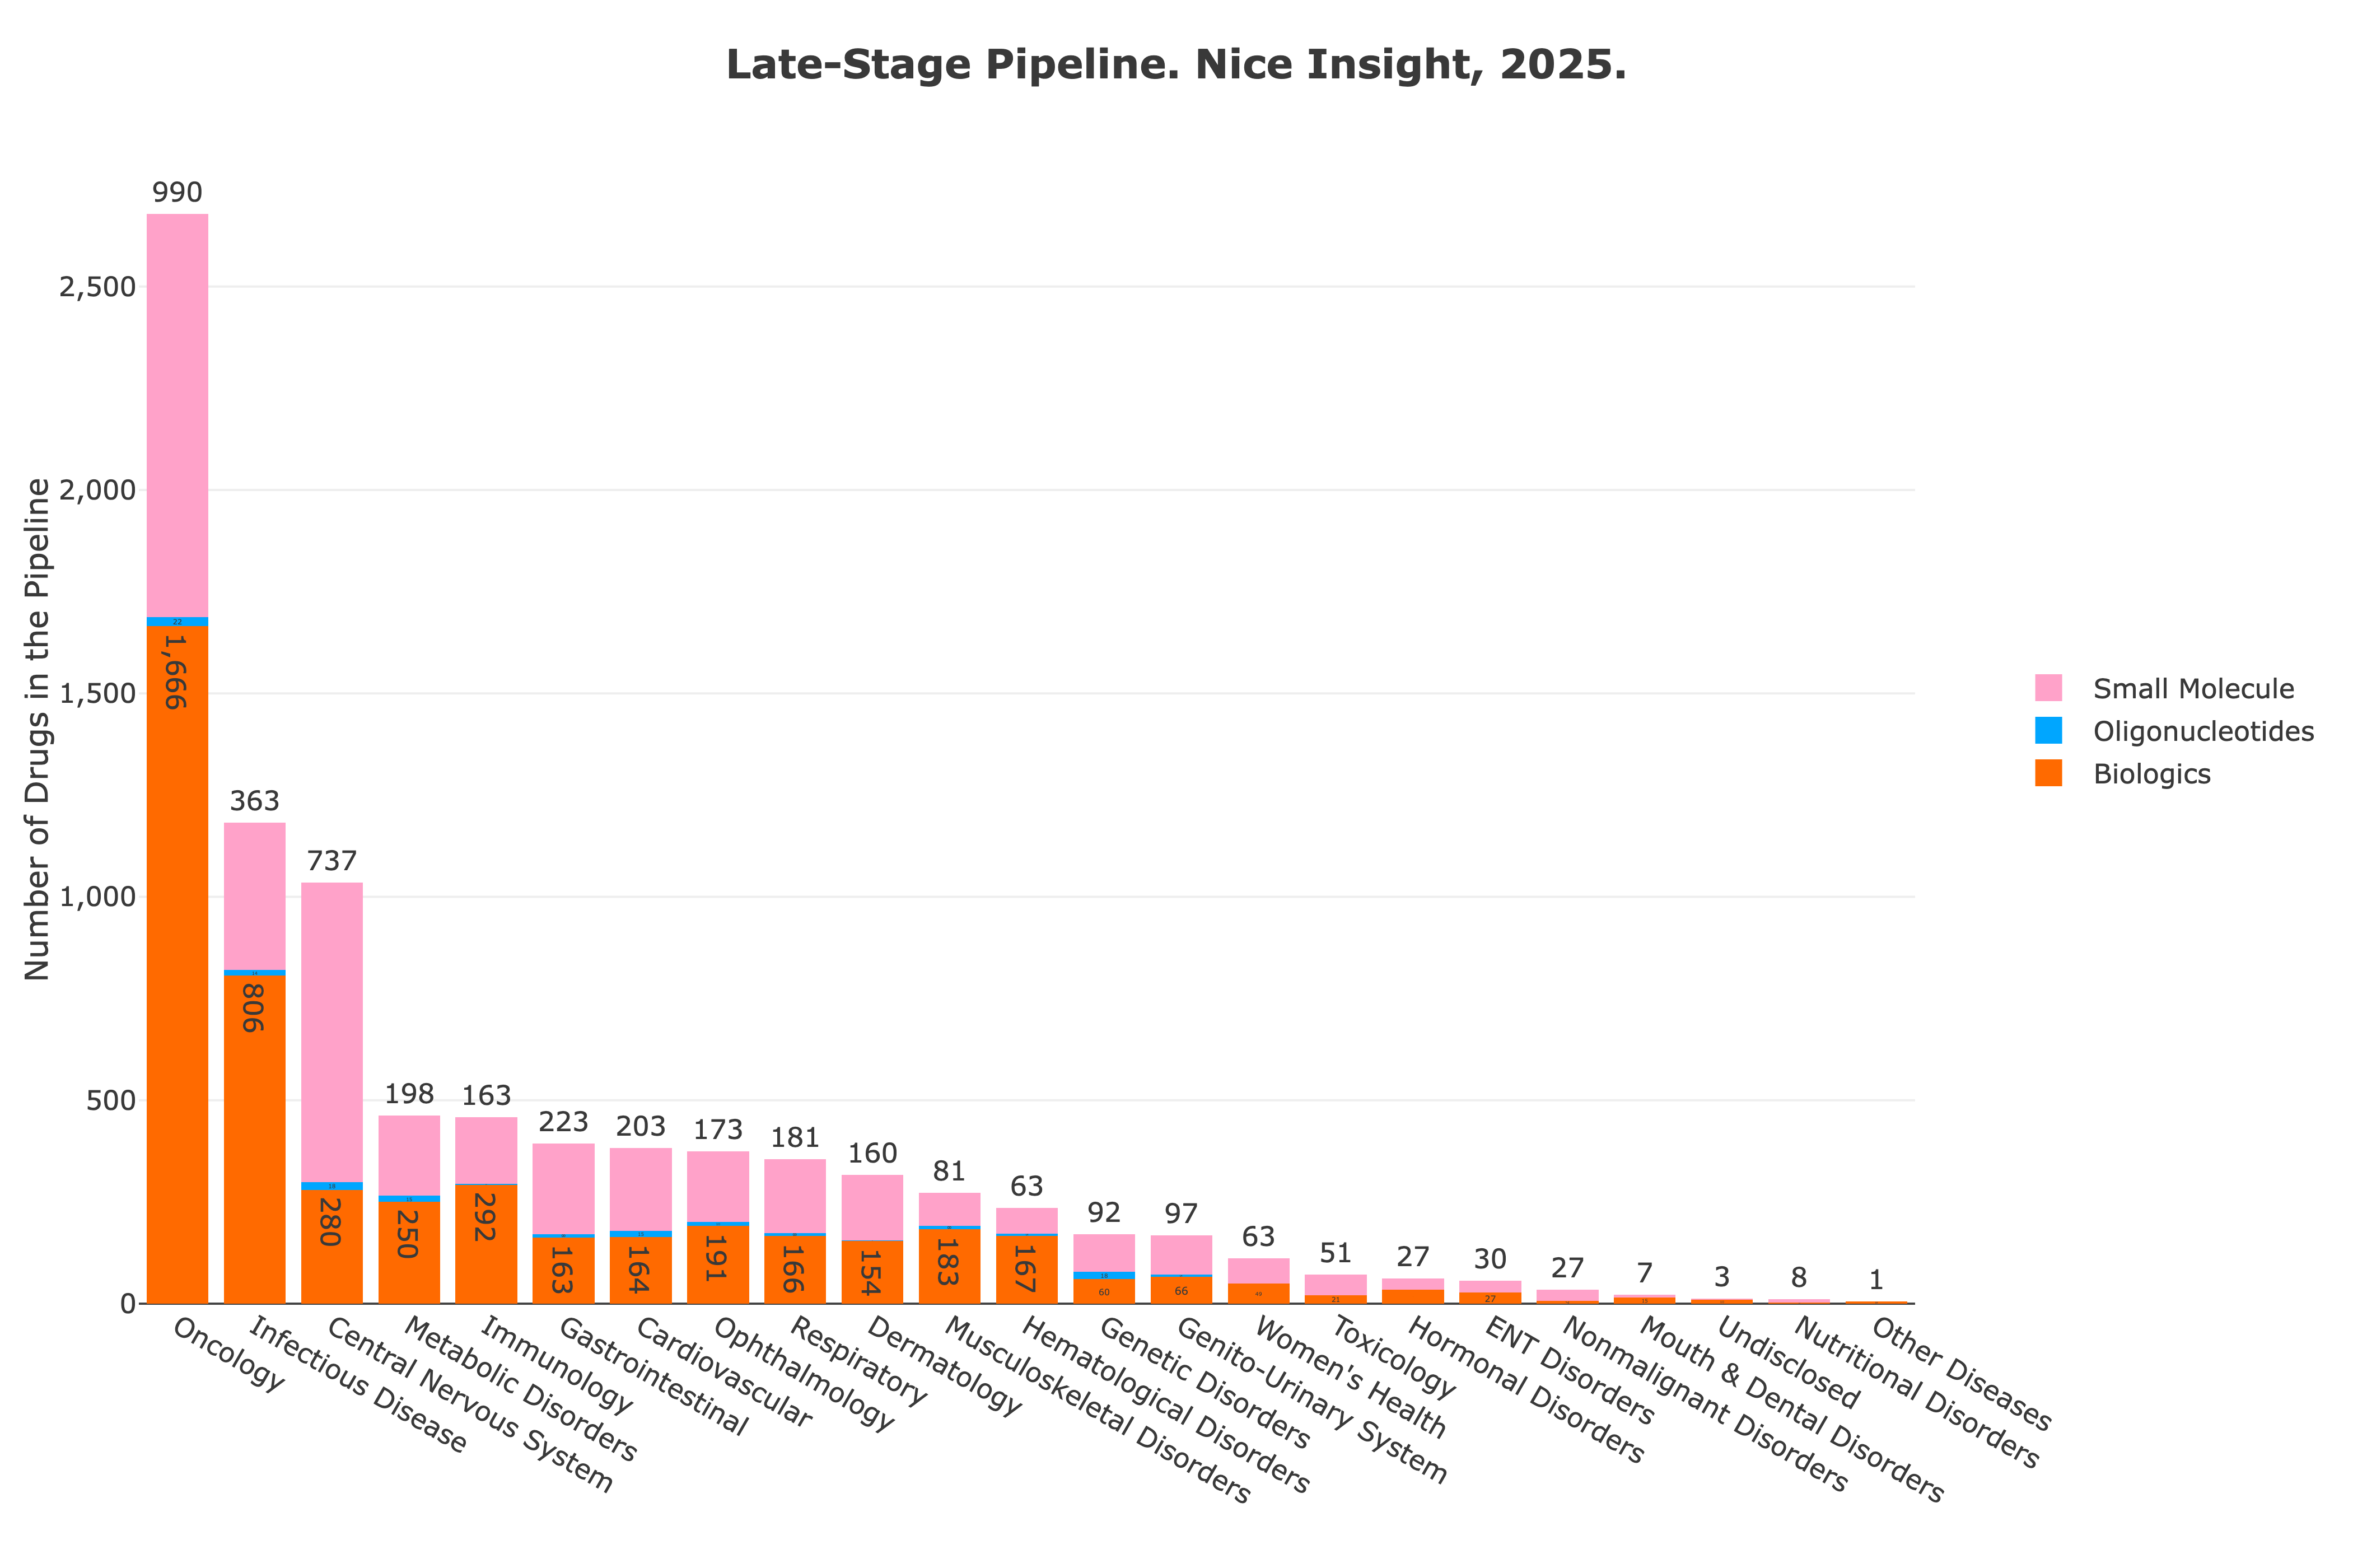 Figure 9. Late-Stage Pipeline: Number of Each Molecule Class by Indication
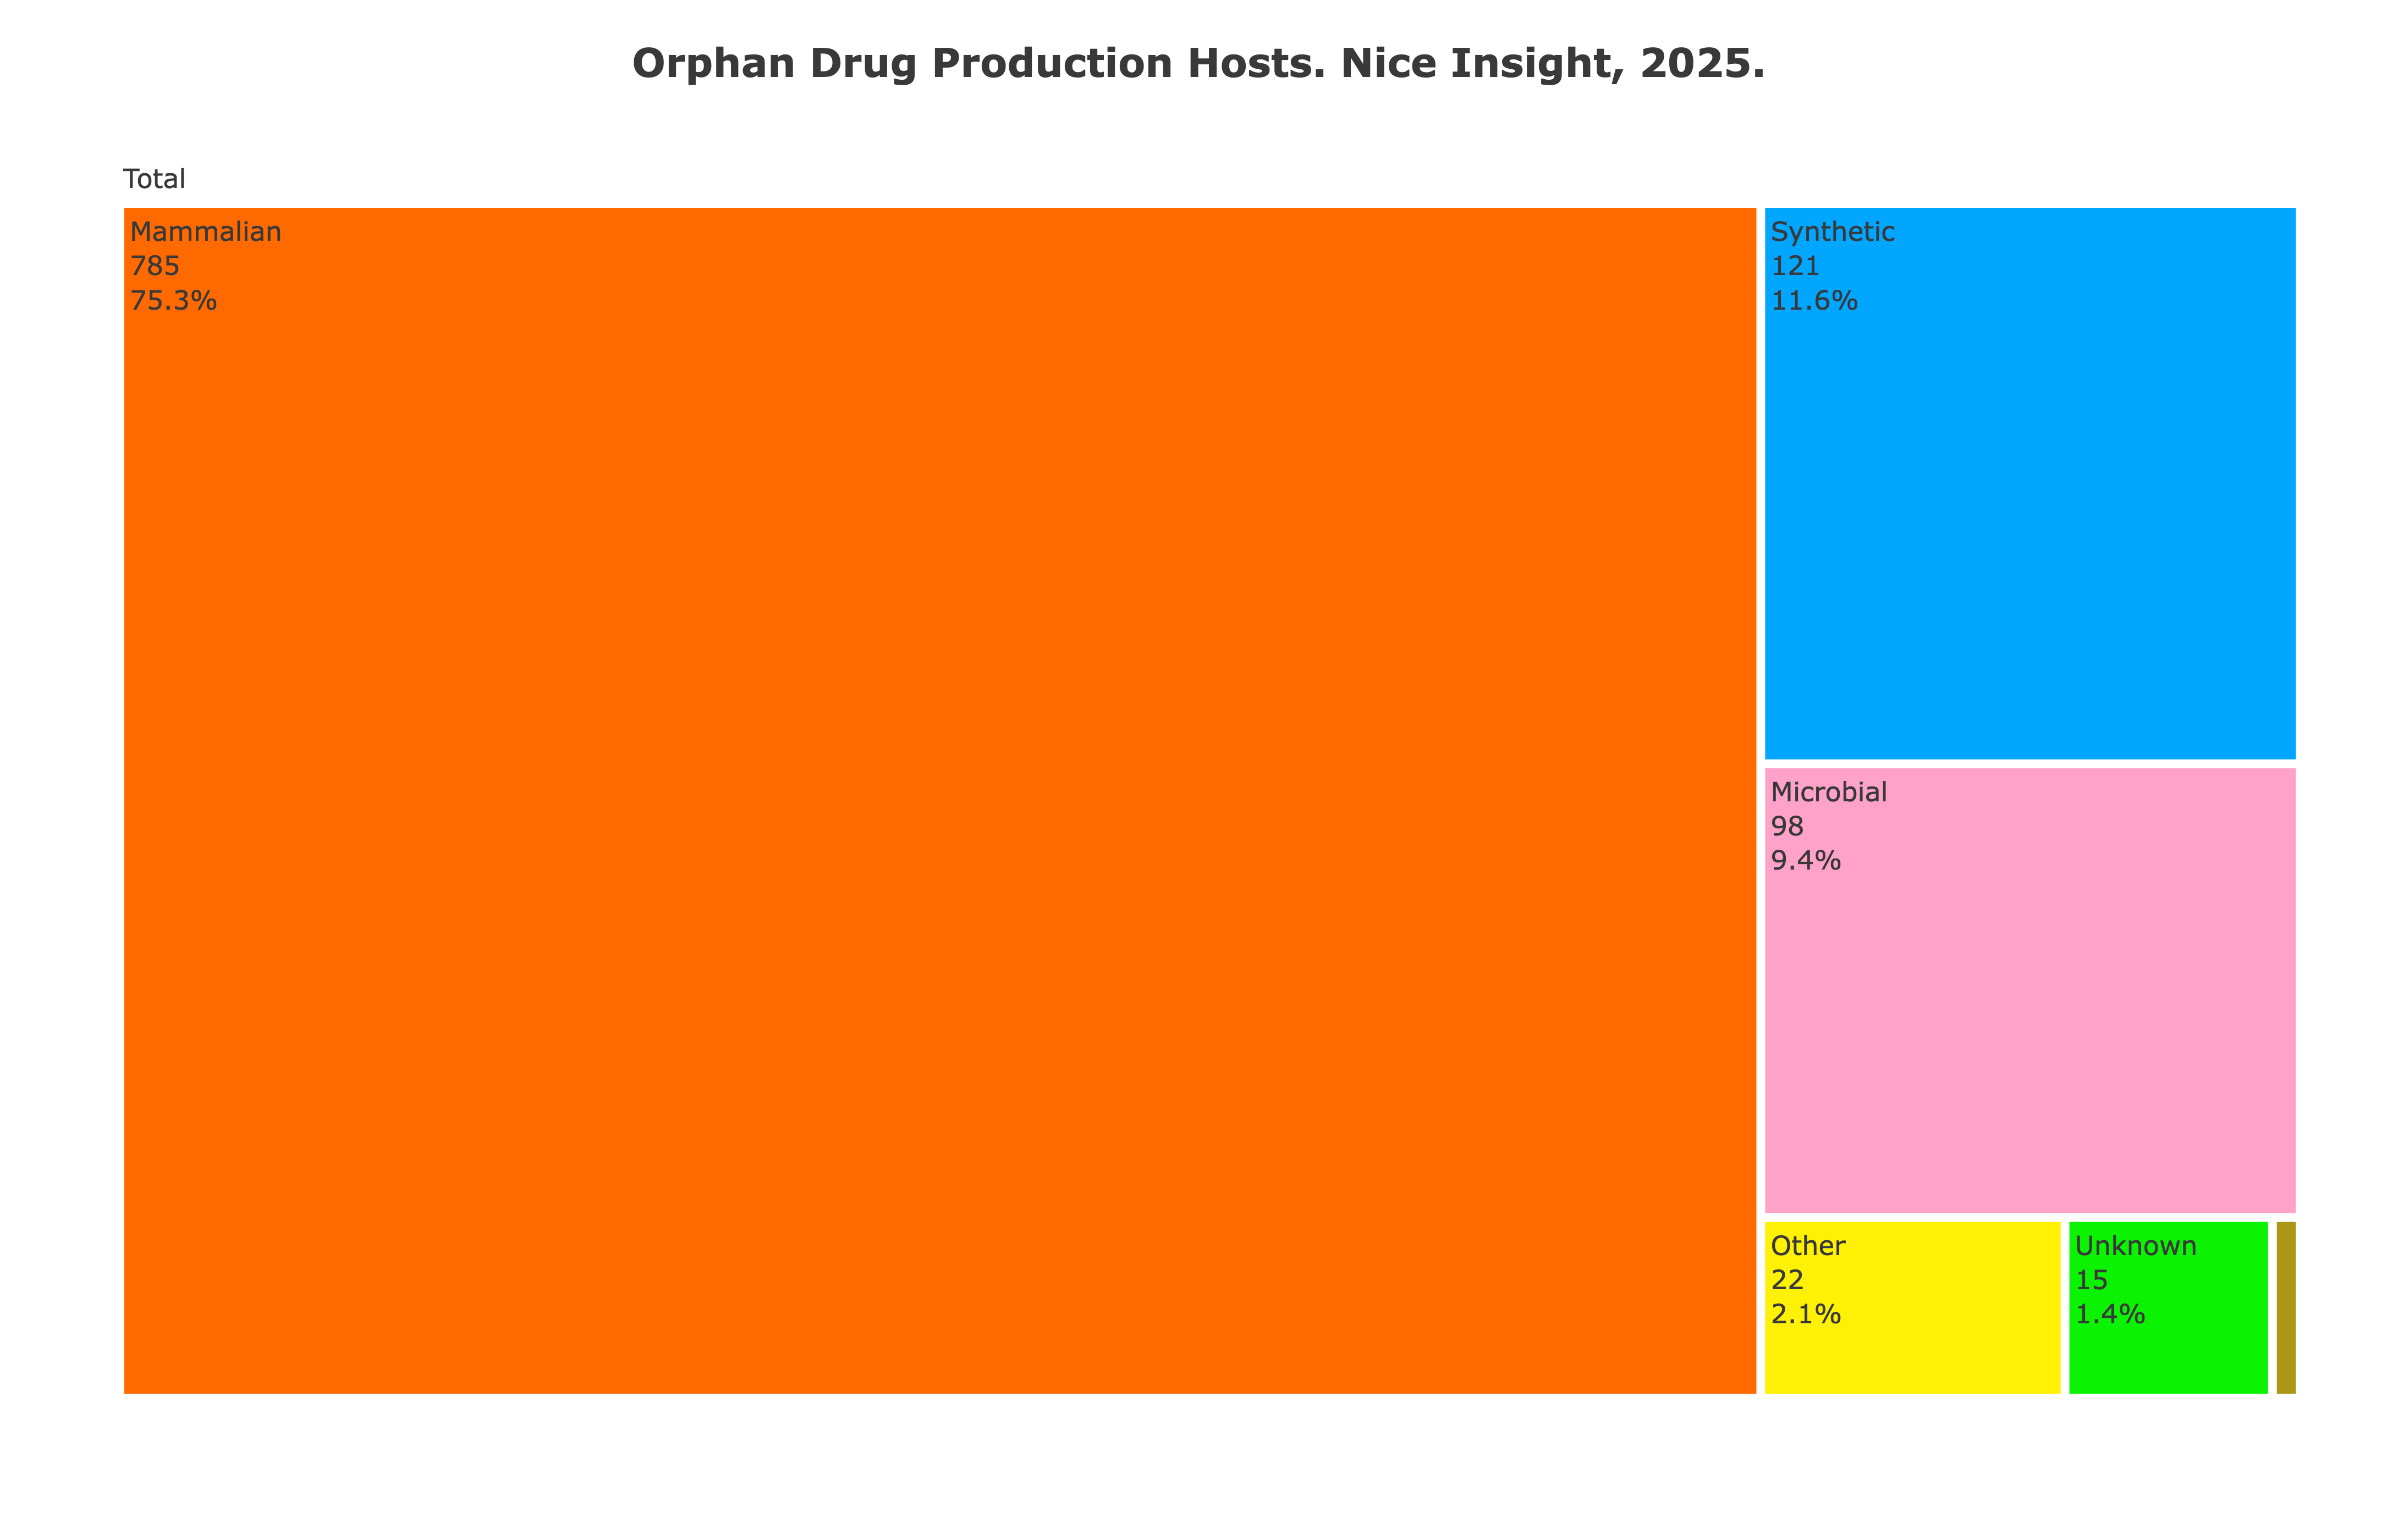 Figure 10. Production Host of Orphan Drug Biologics
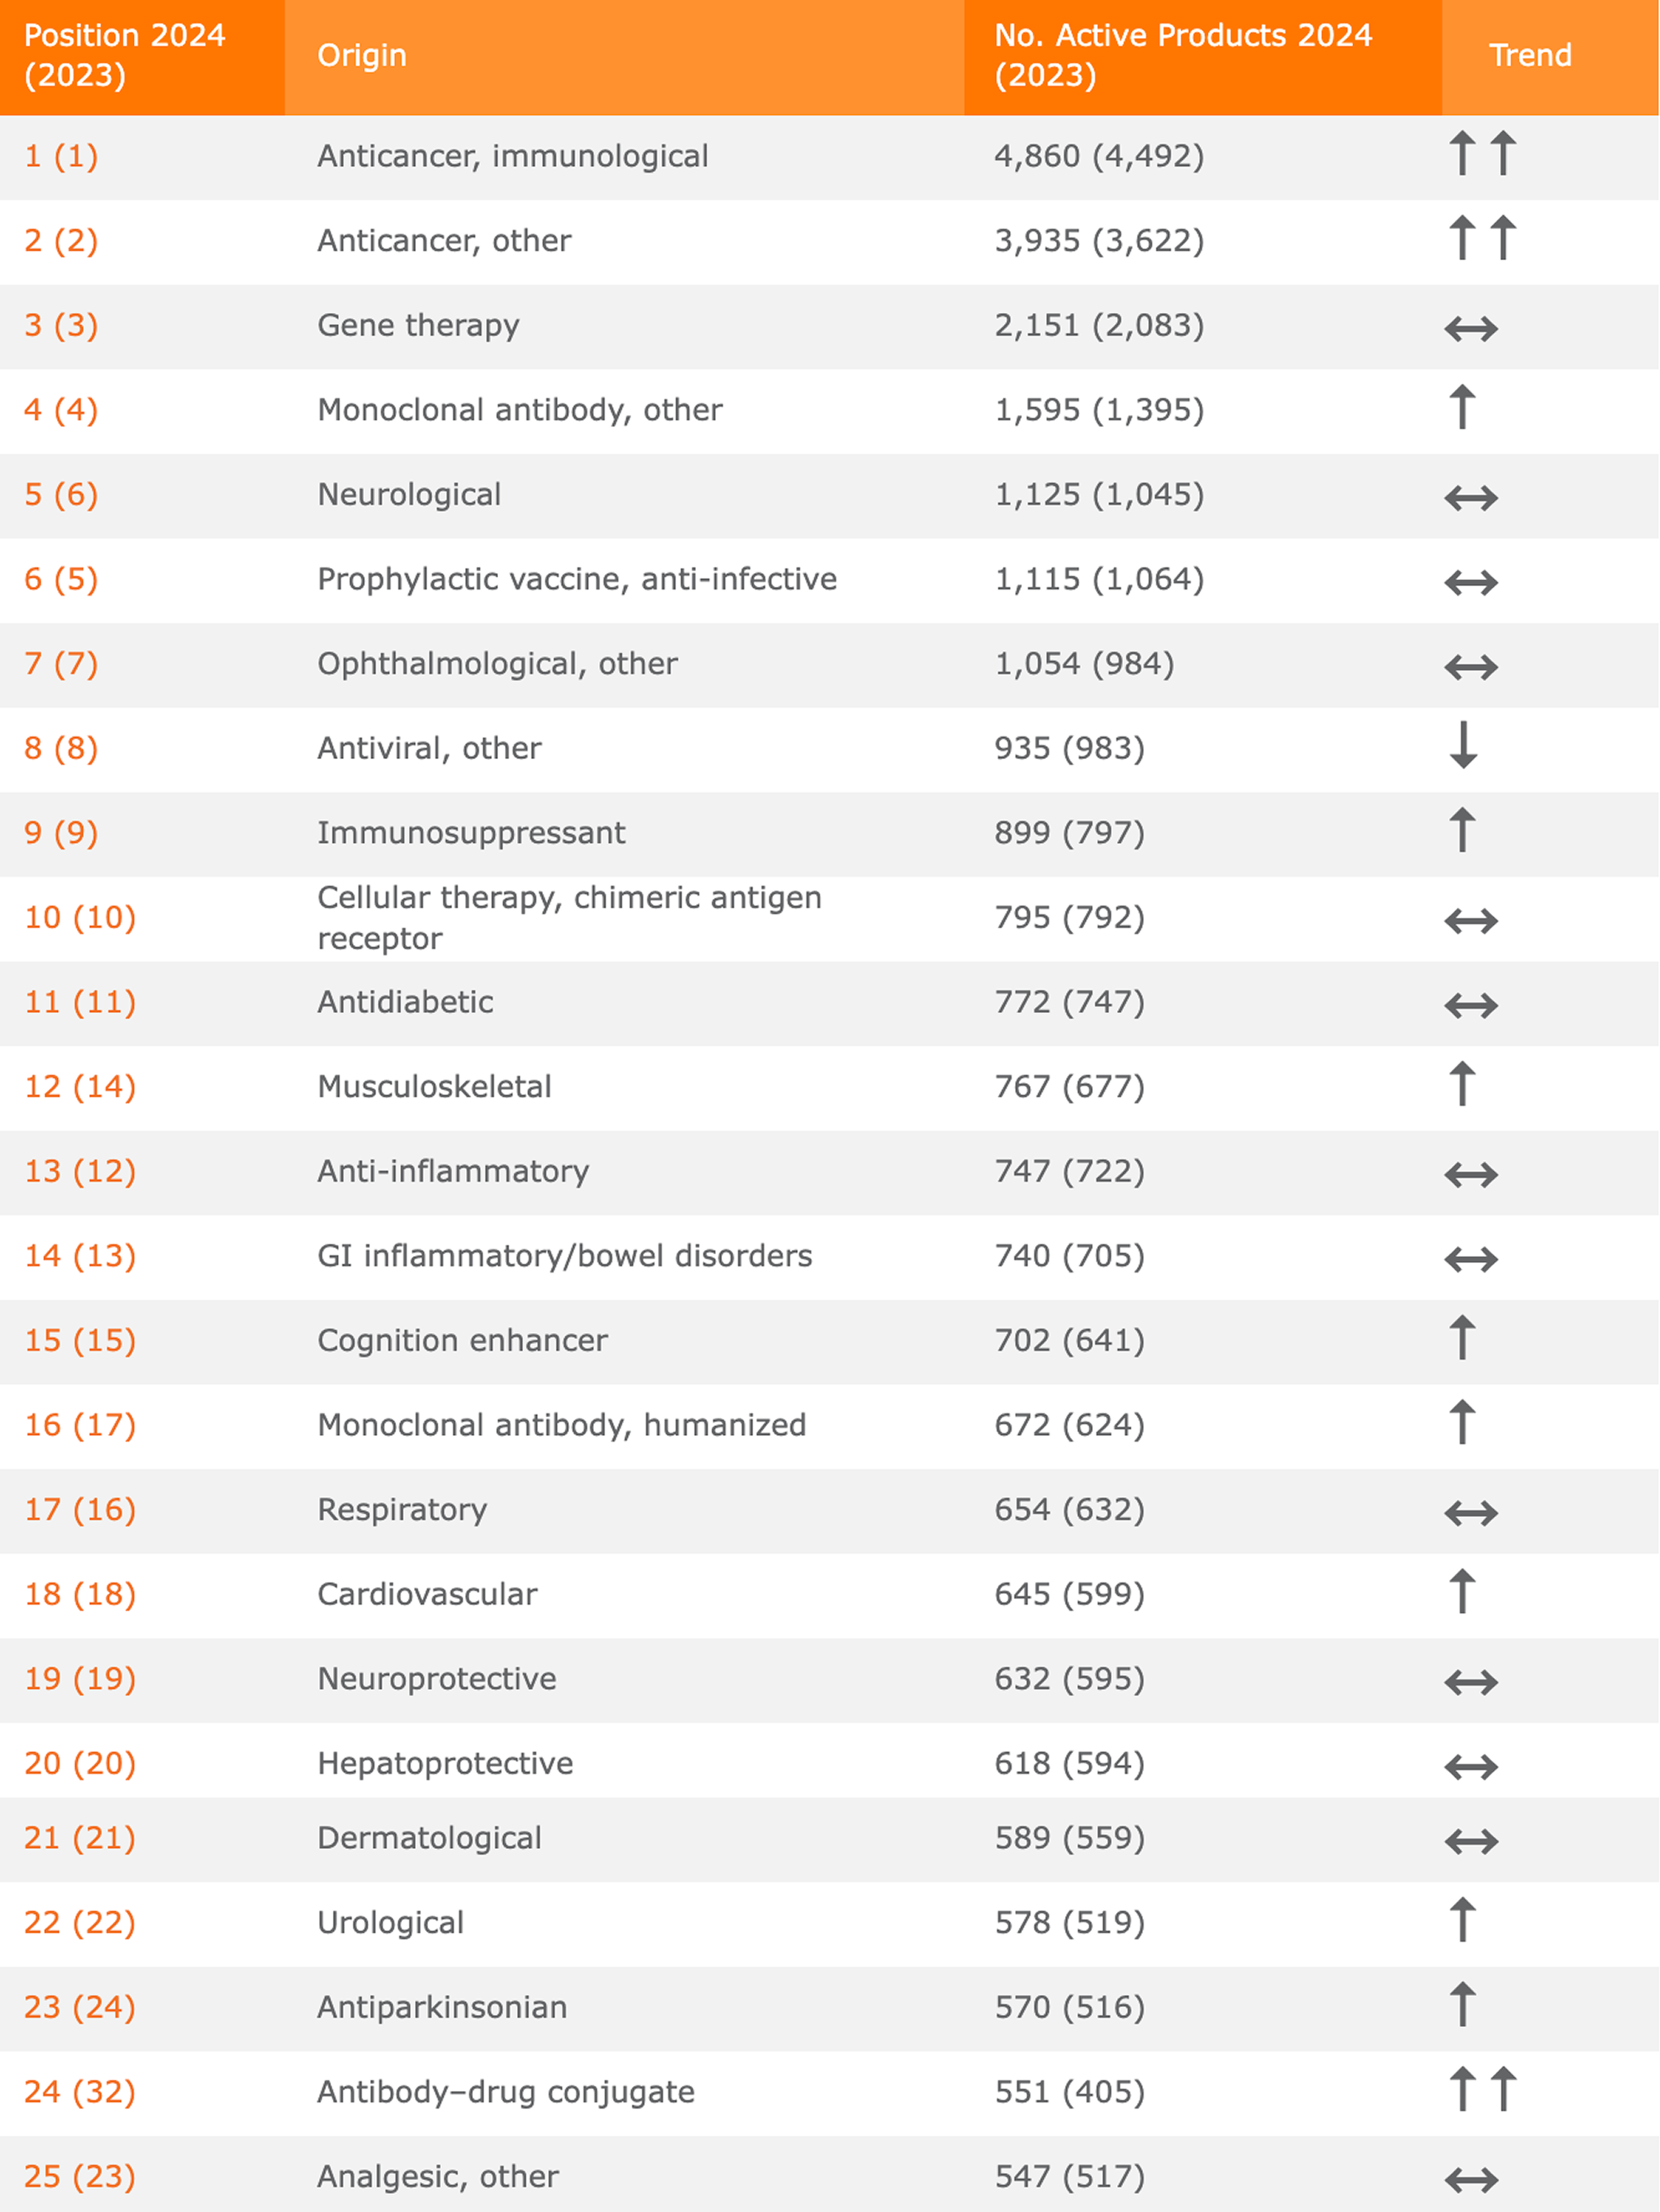 Source: Citeline[2]
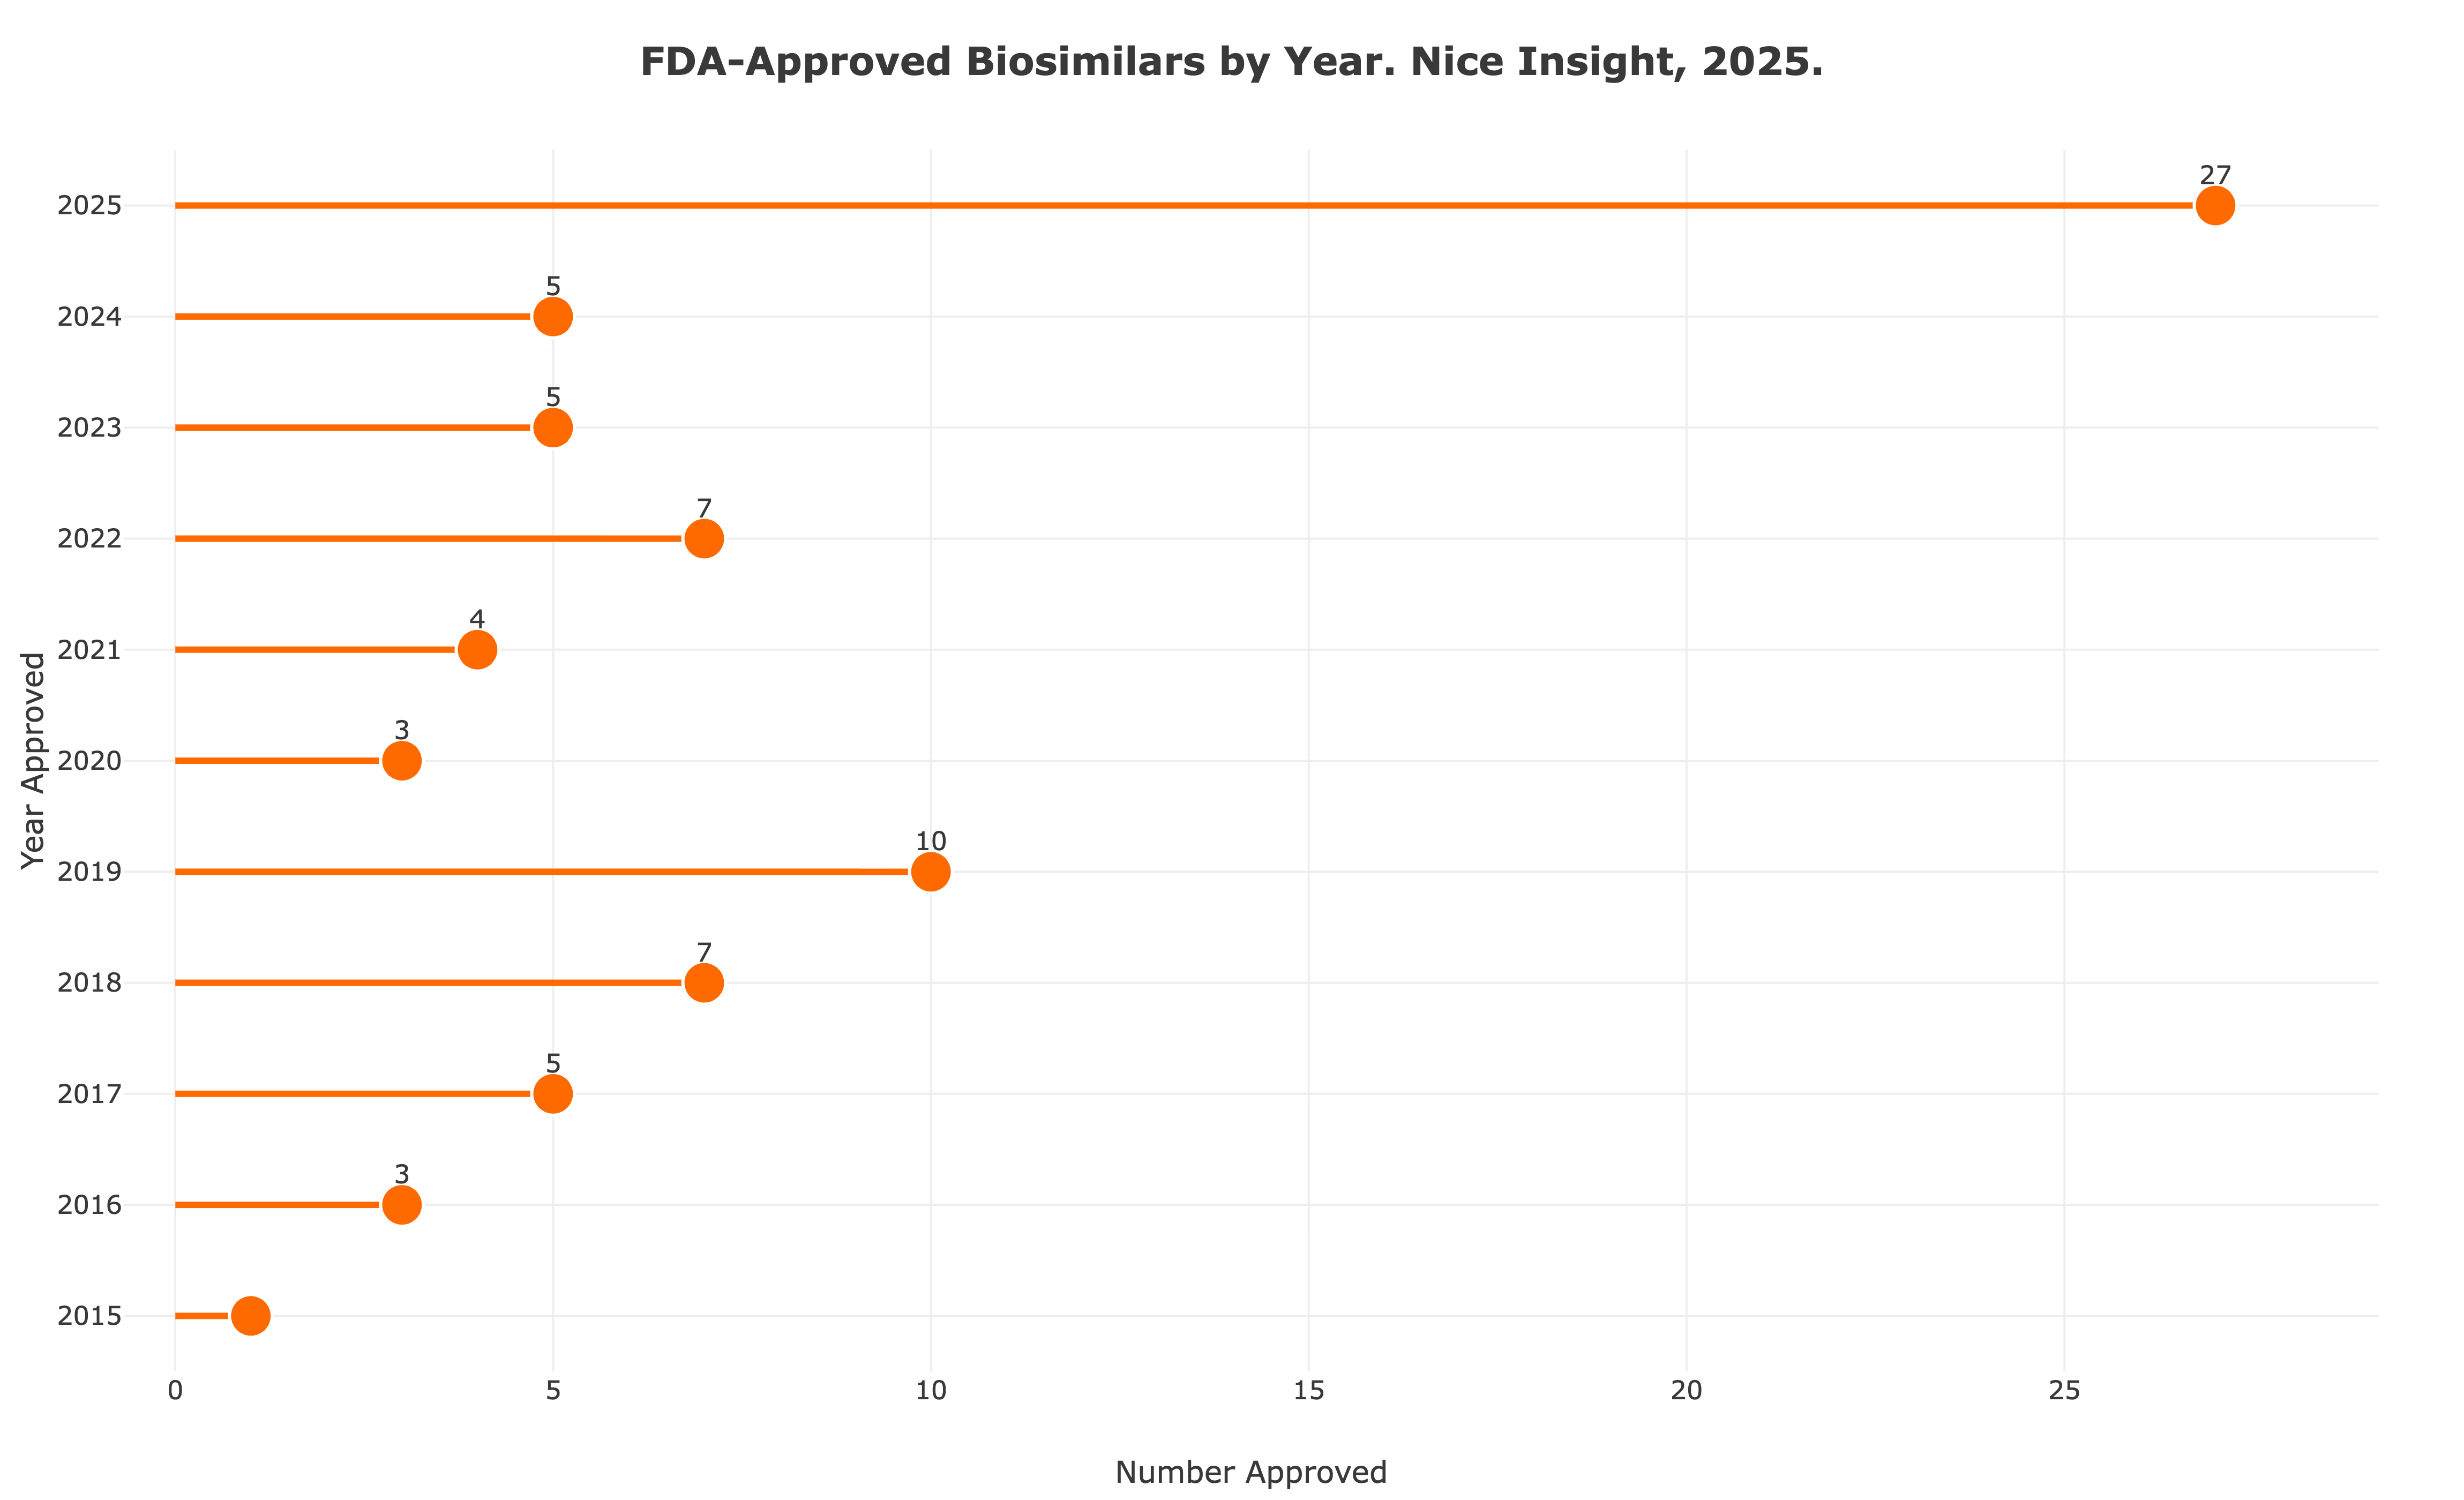 Figure 11. Annual FDA Approvals of Biosimilar Products