In the pharmaceutical industry, indirect emissions across the supply chain account for the majority of the carbon footprint. Traditional accounting methods, such as aggregated facility data and spend-based proxies, do not provide the precise data pharmaceutical companies need to take meaningful action. Product-level carbon footprinting uses life-cycle-based measurements at the batch level, delivering clear insights needed to prioritize and validate reduction strategies.
Carbon Intensity in a Multiproduct Manufacturing World
The healthcare sector, particularly drug manufacturing, contributes significantly to global greenhouse gas (GHG) emissions. Healthcare activities generate approximately 2.4 gigatons of carbon dioxide equivalents (CO₂e) each year — or 4–5% of total global emissions — highlighting the scale of the sector’s decarbonization challenge.1 The GHG Protocol classifies CO₂e into Scope 1 (direct emissions), Scope 2 (indirect emissions from purchased energy), and Scope 3 (indirect emissions across the value chain) (Figure 1).2
 Figure 1. Overview of GHG Protocol scopes and emissions.
Pharmaceutical companies have reduced Scope 1 and Scope 2 emissions significantly through energy efficiency, renewable electricity procurement, and infrastructure upgrades. However, Scope 3 emissions are more complex. They originate from supply chain activities, including outsourced manufacturing, raw material production, logistics, and packaging. Regulatory expectations, investor scrutiny, and procurement standards are evolving, requiring pharmaceutical companies to quantify Scope 3 reduction targets aligned with broader net-zero commitments.3
To meet these targets, drug developers need clear visibility into the most carbon-intensive segments of their supply chains — often upstream operations. Early carbon accounting efforts relied primarily on facility-level averages or spend-based estimates. While practical starting points, particularly when product-level data are difficult to obtain, these methods provide limited insights into how manufacturing decisions influence emissions.
The carbon intensity of contract development and manufacturing organizations (CDMOs) varies by product, rather than remaining constant at the facility level, as the batch size, yield, process configuration, campaign scheduling, and resource utilization all impact carbon emissions. As a result, two products manufactured in the same facility can have materially different carbon footprints due to differences in the media composition, purification intensity, or energy demand — variability that facility averages cannot capture.
Spend-based methodologies introduce further uncertainty. They apply category-average emission factors to financial data, making the results sensitive to price volatility and resulting in generalizations that may not reflect actual process performance. Although the GHG Protocol recognizes these approaches, they lack the granularity to evaluate process improvements, compare manufacturing options, or validate the impact of product-level operational changes.
A life cycle assessment (LCA) at the product level addresses these structural limitations. A product carbon footprint (PCF) framework quantifies emissions for a defined functional unit — typically a batch — across relevant stages of the value chain. By mapping emissions to actual process inputs and activities rather than financial proxies, clients can measure product-level Scope 3 contributions from raw materials, utilities, transport, and manufacturing operations.
This level of detail supports practical decision-making. Clients can compare site options, evaluate process changes, guide tech transfer and scale-up strategies, and quantify the carbon impact of yield improvements or logistics changes. As a result, clients are demanding product-level carbon data in addition to sustainability reports to support audit-ready disclosures and targeted reduction strategies.
Defining a PCF in Practice
A PCF quantifies the GHG emissions of a product across specified stages of its value chain. For drug substances or drug products, the PCF includes emissions from raw material extraction and processing, transportation, manufacturing operations, and utilities. Depending on the PCF boundary, it can also include downstream distribution, use, and disposal.
At Samsung Biologics, PCF is more than a reporting output. It is a structured, data-enabled capability that consistently quantifies and manages product-level emissions to support client decision-making, Scope 3 disclosures, and regulatory or procurement requirements. We emphasize achieving methodological consistency, repeatability, and traceability, rather than producing a single carbon value.
Organizations can apply multiple methods to calculate a PCF, depending on how they intend to use the data — for internal optimization, customer disclosure, third-party verification, or regulatory alignment. Regardless of the approach, they must first clearly define their system boundaries.
Pharmaceutical manufacturing companies typically assess intermediates on a cradle-to-gate basis, covering emissions from raw material extraction through manufacturing. However, drug products are often evaluated more broadly, on a cradle-to-grave basis, incorporating downstream logistics, distribution, product use, and end-of-life management. The boundary directly affects the magnitude and interpretation of the PCF and must be explicitly disclosed. Figure 2 illustrates these life cycle stages, showing how emissions accumulate across the product value chain — from raw material extraction and processing through transportation, manufacturing, downstream use, and disposal.
 Figure 2. Flow of the life cycle assessment.
PCFs are one category in the broader discipline of LCA. While a full LCA evaluates multiple environmental impacts, a PCF focuses specifically on climate-related emissions. PCF data can inform Environmental Product Declarations, support Scope 3 accounting, and enable audit readiness as well as net-zero alignment.
Internally, a PCF delivers operational insights. It links emissions to specific batches, processes, and resource inputs, identifying energy-intensive steps, yield-related inefficiencies, and high-impact supply chain components. However, its credibility and decision-making value depend on the transparent documentation of methodologies, explicit disclosure of assumptions and allocation rules, traceable data lineage, and readiness for third-party review.
For clients partnering with supply chain organizations with advanced PCF capabilities that are actively reducing or have already reduced emissions, PCFs can deliver business benefits beyond sustainability.
Carbon Accounting in a Multiproduct CDMO Environment
Modern drug manufacturing is inherently resource-intensive and structurally complex. Many therapies require multistep synthetic or biologic processes that involve upstream cultivation, downstream purification, formulation, and packaging. Production often spans multiple organizations, with drug substances, drug products, and supporting activities distributed across specialized providers.
Multiproduct CDMO facilities manufacture diverse molecules under constantly shifting schedules. Batch sizes range from milligram-scale development runs to commercial-scale production. Process parameters, yield, media composition, purification intensity, and utility demands differ across programs. As a result, it is not possible to accurately assign emissions to a single product using facility averages alone.
Product-level PCF calculations rely on directly measured inputs wherever possible, including line-specific electricity consumption, batch-specific utilities, and equipment-level operational data. Teams allocate shared utilities and infrastructure based on physical drivers (e.g., process time, throughput, the mass or volume processed, batch count, energy load, or cooling demand) to preserve consistency, traceability, and scientific rigor. They use revenue- or spend-based allocation methods only when primary operational data are unavailable, and clearly disclose their limitations.
Product-level carbon accounting in biopharma also extends beyond onsite operations. Emissions are mapped across all relevant stages of the value chain for a defined functional unit — typically a batch. This includes supplier activities, raw material production, inbound logistics, cell culture and purification operations, formulation and fill-finish (where applicable), outbound transport, and — if included within the boundary — distribution, use, and end-of-life.
A comprehensive PCF can include the following emission categories:
Upstream supply chain: raw material extraction and processing.
Inbound transportation: fuel consumption associated with material delivery.
Drug substance manufacturing: energy, water, and utility consumption during production.
Interfacility transport: shipment of intermediates or bulk substances.
Drug product manufacturing: energy and resource use during formulation and fill-finish.
Downstream distribution and end-of-life: logistics, waste management, and disposal.
Industry groups such as the BioPhorum Sustainability working group3 and the European Federation of Pharmaceutical Industries and Associations (EFPIA)4 emphasize the importance of granular, product-level carbon data to identify high-impact reduction opportunities. In multiproduct biologics manufacturing, this granularity is particularly important because energy-intensive cleanroom operations, yield variability, and campaign design can materially influence carbon intensity.
For CDMOs, PCFs support client engagement and internal performance management, enable transparent disclosure of product-specific Scope 3 contributions, and establish a baseline for mapping and monitoring reduction targets. In certain programs, PCF data inform comparisons of process configurations, batch strategies, logistics routes, packaging choices, development-scale adjustments, and tech transfer or site selection decisions. Because Scope 3 management is key to alignment with the Science Based Targets initiative (SBTi) framework, PCFs also provide a structured evidence base for supply chain decarbonization.
Building a Standardized, Auditable PCF Framework
Samsung Biologics developed its PCF framework in response to increasing client demand for product-level carbon data, driven by Scope 3 decarbonization targets, portfolio carbon management needs, and evolving regulatory and disclosure requirements. Rather than relying on facility averages, Samsung Biologics built a validated, standardized approach to quantifying emissions at the product and batch levels.
The company aims to establish a consistent, auditable internal methodology. External benchmarking across contract manufacturers only works when system boundaries, allocation principles, emission factors, functional units, and data quality hierarchies align. Without this consistency, numerical comparisons become misleading. For this reason, Samsung Biologics prioritizes internal rigor, transparency, and traceability over headline carbon figures and aligns its reduction targets with SBTi5 standards.
At Samsung Biologics, PCF does not function as a standalone sustainability report. This data-enabled capability is embedded in program execution and supports ongoing collaboration with clients. The framework captures emissions data from upstream supply chain inputs, transportation, and manufacturing operations, providing a structured view of how emissions accumulate across the product life cycle (Figure 3).
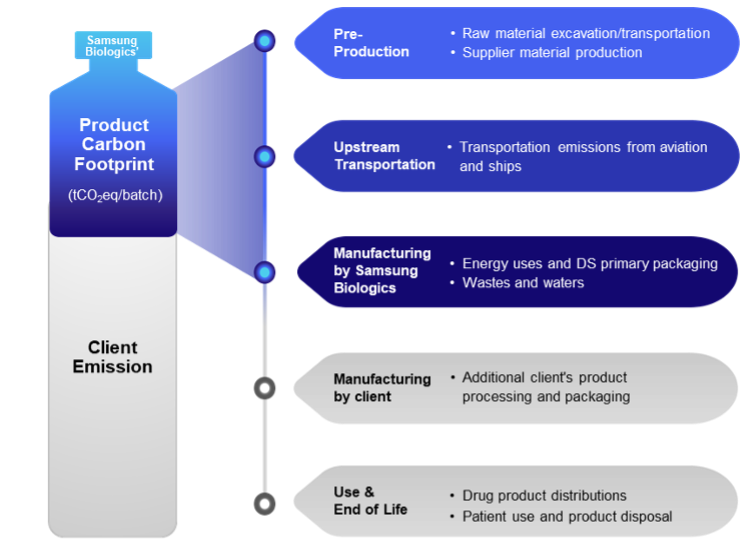 Figure 3. Emission sources contributing to product carbon footprints in biopharmaceutical manufacturing.
Within the ExellenS™ framework for optimized, equivalent manufacturing across multiple facilities is a sustainability data layer that includes PCFs. The framework quantifies environmental performance across sites and provides a structured basis for evaluating differences in emissions driven by the grid mix, campaign configuration, or process design. In this context, PCFs inform decisions on site selection, campaign planning, and manufacturing strategy.
Samsung Biologics always balances transparency with confidentiality. Within the parameters of non-disclosure agreements and contractual terms, the company carefully manages product- and batch-specific data. Samsung Biologics also aggregates or anonymizes outputs, where appropriate, while clearly documenting its methodology, system boundaries, allocation logic, and key assumptions. This approach allows clients to use PCF data confidently without compromising proprietary information.
Samsung Biologics’ PCF system has undergone independent third-party validation, aligning with recognized standards and reflecting the company’s focus on methodological clarity, data lineage, and audit readiness. As sustainability increasingly influences procurement, regulatory considerations, and partnership decisions, PCFs offer the infrastructure needed for sustained, evidence-based collaboration with clients.
Operationalizing PCF: Data, Methods, and System Architecture
Samsung Biologics’ PCF system is automated, ensuring consistency, repeatability, and scalability across programs and sites. This automated system calculates emissions in CO₂e units per batch, aligns with client-specific methodological requirements, applies mass- and process-based accounting principles rather than spend-based estimates, and integrates data on materials, transportation, energy consumption, water usage, and waste generation.
Det Norske Veritas independently validated the system in 2025 and confirmed its alignment with recognized international standards.
The transition to an automated PCF system involved three structural shifts. First, Samsung Biologics moved from using monetary proxies to using physical and process units, such as kilograms, liters, kilowatt-hours, and batch hours. Second, the company established product- and batch-level mapping logic using bills of materials, batch production records, yield data, and step-level resource consumption. Third, it replaced broad category emission factors with supplier-, region-, or technology-specific factors, where possible. These changes reduced the reliance on generalized assumptions and created a more transparent carbon model.
The new model prioritizes measured data whenever feasible. The system draws on operational sources, such as manufacturing execution systems, utility and energy monitoring platforms, and equipment-level performance data. By linking emissions directly to production activity, the model enables batch-level allocation rather than defaulting to site-wide averages.
Data maturity remains a practical constraint across the biopharma supply chain. While some strategic suppliers provide primary emissions data, most do not generate product-specific PCFs, and only a limited subset provides high-quality, measured product-level data. To address this variability, Samsung Biologics applies a defined data hierarchy: primary measured data, supplier-provided data, secondary database factors, and estimated values. When the system uses secondary or estimated data, it applies conservative assumptions and discloses uncertainty ranges. It also documents supplier engagement roadmaps to increase primary data coverage in high-impact categories.
A standardized workflow reinforces data lineage and audit readiness. The system collects activity data from operational systems, maps them to defined functional units, and links them with appropriate emission factors for electricity, steam, chilled water, raw materials, and logistics. Outputs include documented system boundaries, allocation methods, data sources, assumptions, and uncertainty disclosures to provide support for review and verification.
The system defines boundaries at the product or project level and discloses them in its deliverables. The default boundary is cradle-to-gate, which can be expanded to include downstream activities (e.g., fill-finish, packaging, distribution, or end-of-life) based on data availability and client requirements.
In addition to supporting clients’ Scope 3 reporting and reduction planning, Samsung Biologics uses PCF outputs to inform its decarbonization pathway. Baseline PCF values established in 2022 guide internal reduction initiatives. They include energy efficiency improvements, the gradual replacement of liquid natural gas boilers with electric or hydrogen-based systems starting in 2040, and the increased procurement of renewable electricity and onsite generation. Vehicle fleet electrification, increased water reuse, waste reduction, and targeted supply chain engagement also comprise the reduction initiatives. The company has set a net-zero target for 2050, aligned with a 1.5°C climate pathway. PCF data provide a structured mechanism for tracking emissions reductions across both onsite operations and the broader value chain (Figure 4).
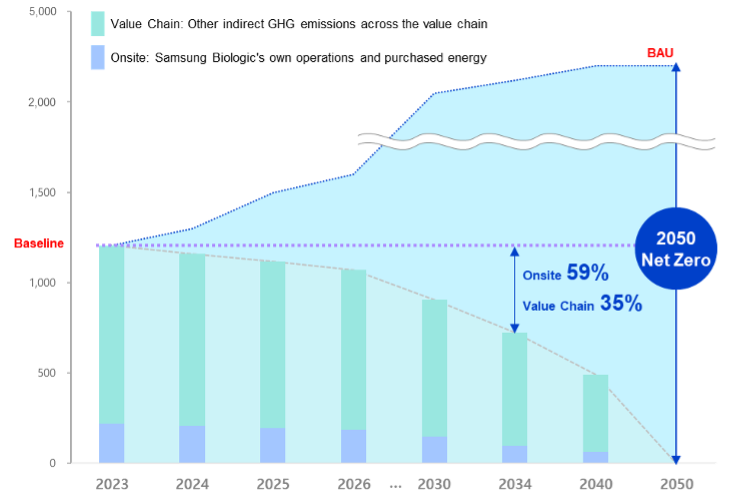 Figure 4. Emissions reduction pathway demonstrating Samsung Biologics’ commitment to achieving net-zero GHG emissions by 2050.
Scope 3 Reality: Supplier Data, Maturity, and Engagement
Limited access to product-specific data remains a persistent challenge in product-level carbon accounting. Only a few suppliers in biopharma currently provide primary product-level data. Many report at the company level or rely on category-average emission factors instead of generating measured PCFs.
This uneven data maturity directly affects Scope 3 accounting. Raw materials, consumables, and logistics services often contribute significantly to product-level emissions, so improving upstream data quality remains critical to increasing overall accuracy.
Samsung Biologics approaches this issue as an opportunity for collaborative development rather than as a compliance exercise. The CDMO uses PCF analysis to identify high-impact suppliers and materials, creating a structured basis for engagement on lower-carbon alternatives, renewable energy adoption, process improvements, and logistics optimization. In this way, PCFs direct efforts toward the highest-impact reduction opportunities.
The company is progressively expanding primary data coverage, beginning with high-impact categories. To support this expansion, Samsung Biologics uses standardized supplier templates that define system boundaries, reporting units, and verification levels, enabling suppliers to provide usable data even if they lack in-house PCF or GHG accounting capabilities. Large global suppliers often maintain established emissions accounting systems, but many small and medium-sized local suppliers do not. The templates allow suppliers to report operational data, such as energy consumption and the types and quantities of raw materials. Samsung Biologics uses its standardized methodologies to convert this information into emissions estimates. The company embeds ESG data requirements into procurement contracts and supplier evaluations. It also runs joint improvement initiatives in priority areas, such as critical raw materials, packaging, and logistics, while also providing supplier education on PCF and LCA fundamentals to build long-term capabilities.
In this way, Samsung Biologics seeks to evolve Scope 3 accounting from a static reporting exercise into a structured pathway for supply chain decarbonization that aligns with client expectations and net-zero strategies.
Using PCF to Inform Manufacturing and Supply Chain Strategies
For clients, product-level carbon data are not an abstract sustainability metric. These data become actionable when integrated into planning, reporting, and operational decision-making.
PCF data support Scope 3 accounting and external disclosures. As reporting frameworks mature and procurement processes incorporate environmental criteria (particularly in European markets), clients will require product-specific emissions data that can withstand audit scrutiny. Batch-level PCF outputs include structured documentation of system boundaries, allocation methods, and data sources, strengthening the defensibility of Scope 3 disclosures.
Beyond reporting, PCF data inform manufacturing and supply chain strategies. By mapping emissions to specific processes, inputs, and logistics pathways, clients can evaluate how technical and operational decisions influence carbon emissions. For example, a PCF analysis can reveal the emissions impact of:
Yield improvements or process optimization.
Changes in batch size or campaign scheduling.
Manufacturing site selection based on a regional electricity grid mix and access to low-carbon energy.
Transportation mode or routing changes.
Packaging configuration adjustments.
During development and scale-up, clients can use PCFs to compare process options before committing to commercial production. During tech transfer or site transitions, PCFs provide a structured basis for evaluating environmental performance alongside cost, capacity, and quality considerations.
PCFs also optimize prioritization. By identifying product-level emission hotspots — whether driven by specific raw materials, utility demand, or logistics — clients can focus on actions that deliver measurable impact. This avoids low-impact or symbolic initiatives that do not materially improve Scope 3 performance.
When clients and CDMOs use a shared, transparent carbon framework, sustainability discussions shift from general commitments to evidence-based collaboration. Using consistent assumptions and defined functional units in this context, PCFs serve as a common analytical language for evaluating reduction targets, supply chain engagement, and manufacturing decisions.
Toward Greater Maturity in Product Carbon Accounting
PCF adoption in the pharmaceutical sector remains at an early stage. While organizations are recognizing that product-level accounting is essential for Scope 3 management, they are still refining the methodologies, improving data maturity, and integrating systems. As data quality and digital infrastructure advance, PCFs will shift from specialized reporting tools to embedded operational functions.
Client expectations will expand in parallel. Clients are moving beyond high-level Scope 3 disclosures toward more granular portfolio emissions management, including program-specific reduction targets. This progression requires precise product-specific data and a clear link between manufacturing decisions and carbon outcomes.
Samsung Biologics expects that suppliers will provide more primary data, especially in high-impact categories. Organizations will adopt third-party verification practices as procurement standards and disclosure requirements mature. Digital measurement, reporting, and verification tools will also play a larger role by strengthening data traceability and reducing reliance on manual estimates.
Over time, companies will integrate PCFs into their core operational decision-making processes. They will factor carbon intensity, alongside cost, quality, and capacity considerations, into process design choices, campaign planning, renewable energy procurement strategies, logistics configuration, and site selection. In this context, PCFs function not just as reporting outputs but also as operational performance indicators.
Industry groups such as BioPhorum and EFPIA are driving greater alignment in methodologies and category rules, improving transparency and comparability across the value chain. However, variability in biologics manufacturing, including differences in molecular complexity, process intensity, and facility configuration, will continue to limit full cross-industry comparability.
Clients, CDMOs, suppliers, and industry groups must continue collaborating to improve data maturity and align on methodologies. As companies embed product-level carbon accounting into their manufacturing systems, PCFs will reinforce targeted, evidence-based decarbonization across the pharmaceutical supply chain.
References
1. Rasheed, Fawzia N, et al., “Decarbonising healthcare in low and middle income countries: potential pathways to net-zero emissions.” BMJ. 375: 1284 (2021).
2. Booth, Amy, et al. “Pharmaceutical company targets and strategies to address climate change: content analysis of public reports from 20 pharmaceutical companies.” Int. J. Environ. Res. Public Health 20: 3206 (2022).
3. Whiting, Andy, et al. “Developing a harmonized approach to product carbon footprint data for the biopharma industry.” BioPhorum Operations Group Ltd. 12 Feb. 2024.
4. Advancing Environmental Sustainability Assessment of Pharmaceuticals Through Standardisation and Harmonisation of Product Carbon Footprint Assessment. European Federation of Pharmaceutical Industries and Associations. Nov. 2025.
5. “Standards and guidance.” Science Based Targets Initiative. Accessed 2 Mar. 2026.